USER STORY
Citywide Health Initiative Improves Lives in Rancho Cucamonga
In 2008, the City of Rancho Cucamonga, California, faced the sad fact that the health of its citizens was declining. Obesity and diabetes were on the rise, a phenomenon that is occurring in many cities and towns across the United States. In response, the city decided to develop the Healthy RC initiative. It started out as a special project in which staff reviewed local health rates and compared that information with county data. The findings indicated that half the city's adult population was overweight or obese.
City staff knew that success for the initiative would require collaboration across all departments, community-based organizations, businesses, cultures, and public institutions. They started by getting the departments together and asking what each was currently doing to improve community health and how their processes and workflows could change to support the Healthy RC initiative.
Through interdepartmental collaboration and comprehensive community engagement, staff developed a strategy for Healthy RC—asking residents, businesses, schools, faith communities, and other stakeholders how to improve the health of individuals, families, and neighborhoods. The strategic plan included eight health priorities: healthy eating and active living, community connections and safety, education and family support, mental health, economic development, clean environment, healthy aging, and disaster resiliency.
Staff recognized that location intelligence was essential to understanding the health of their community and finding solutions that improved the lives of citizens.
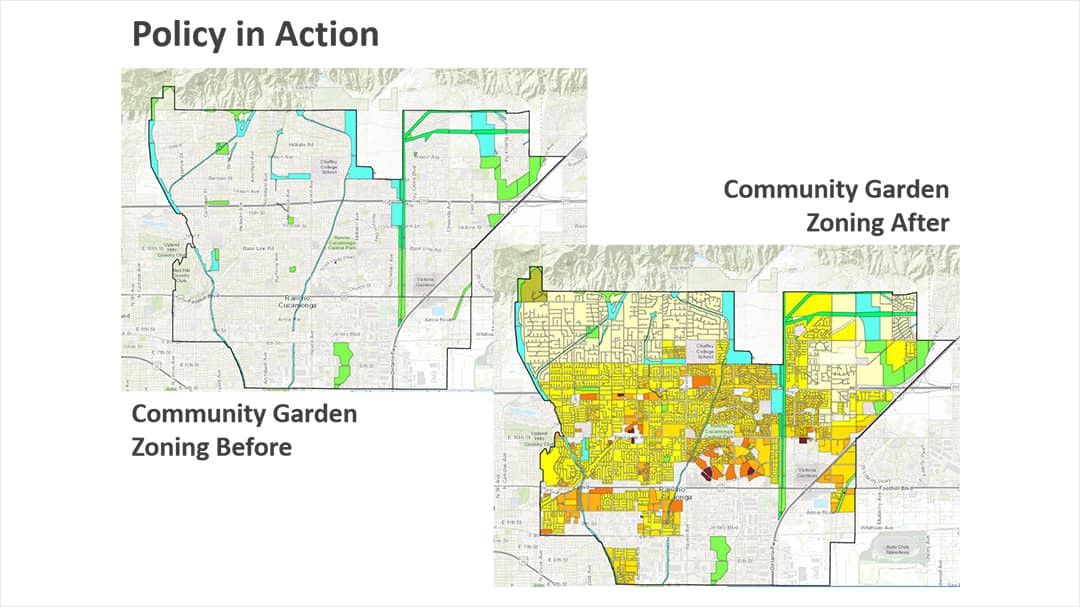
 Community Garden Zoning Policy Before and After shots.
Challenge
The primary goal of Healthy RC was to make a positive difference in the lives of Rancho Cucamonga's citizens. While the city knew that health problems were on the rise, staff needed more specific information—more data—to help them make good decisions and take appropriate action.
In most cities, the location and composition of neighborhoods can represent significant disparities between incomes and access to nutritious food and health care. Citizens living in one neighborhood may have limited or no access to amenities such as parks, farmers markets, and grocery stores, while nearby, other people have opportunities for healthy lifestyles. Whereas one area could be seen as dangerous or unsafe for children to walk to school, another may have community gardens that are not available to people living close by. Even zoning, which determines the type of permitted land use, can contribute to negative health effects for some of the population.
For the City of Rancho Cucamonga, perhaps the biggest hurdle to getting the data it needed was in reaching out and engaging the citizens themselves. To achieve the granularity of localized data, staff needed to do the in-person health surveys necessary for understanding the lives of citizens in different parts of the city. The data would serve as a baseline for verifying their assumptions about the neighborhood characteristics and, ultimately, help them develop targeted strategies to improve health outcomes.
To meet the goals and objectives of Healthy RC, the city had to consider all these factors. The Healthy RC team needed a way to bring the data together in one place so it could be analyzed and the findings presented to decision-makers and the public.
We used location intelligence to engage the public in a new and powerful way. It improved the quality of the relationship between the city government and its citizens, which resulted in a healthier community.
Solution
Using ArcGIS, a mapping and analytics platform, the Healthy RC team members first analyzed neighborhood-level data and identified the most disadvantaged areas, where health issues were greatest and healthy options were most scarce. Next, they compared those areas with Rancho Cucamonga's overall poverty and median income data to better understand the disparities between different parts of the city.
To establish a baseline, the team members created a paper-based survey that they could take into the field as they went door to door to interview people. They also held community events, went to city parks and trails, and deployed an online survey. This way, the team could connect with people wherever they were.
With this initial set of new information entered in ArcGIS, staff were able to quickly determine food deserts—areas where it is difficult to purchase affordable, healthy food. Using maps, the team members could see where sidewalks, grocery stores, and parks already existed or were needed. To learn which areas were considered unsafe, they connected the data with the survey information, crime statistics, and community stories.
Through collaboration, citizens were able to use maps to identify places that were unsafe for their children to walk or play in. Residents also communicated where they would most like to see a community garden or a farmer’s market.
Bringing all this information together in ArcGIS allowed the city to investigate how current zoning was impacting neighborhood health and how changes to the zoning could benefit different neighborhoods.
The more information the team gathered, the faster the city could make informed decisions and take meaningful action. Additionally, the Healthy RC team began using smart technology to speed data collection. Fieldworkers used Survey123 for ArcGIS on smart tablets to collect data more accurately, which allowed them to identify issues at the census tract level. By going digital, the team was able to expedite companion projects, such as the Safe Route to School initiative, which was designed to work with kids to show where safer crosswalks and lower speed limits were needed.
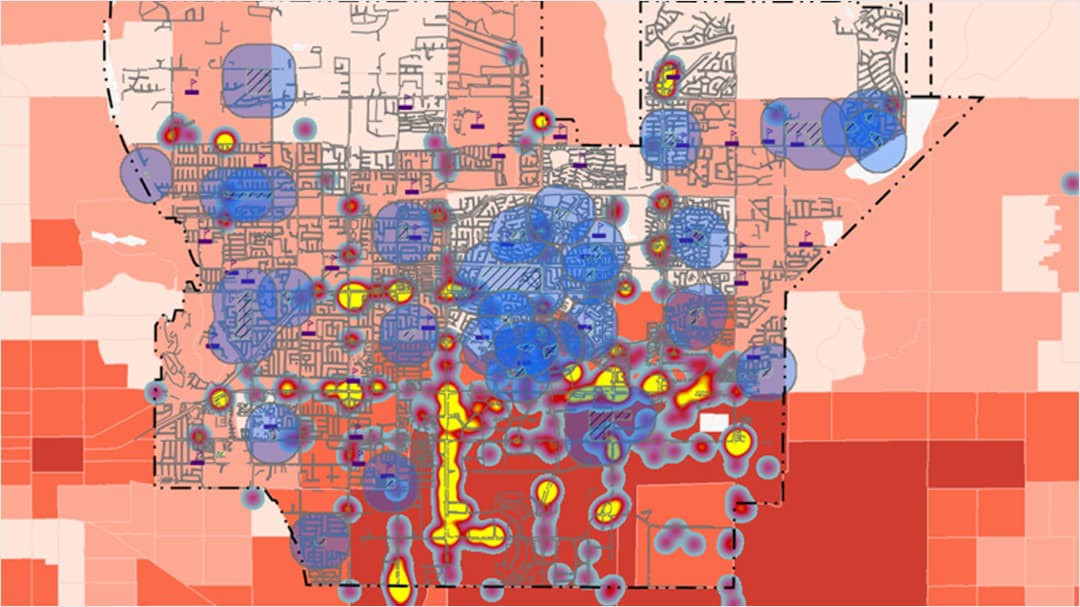
 This map was used by staff to understand some of the reasons people may or may not walk to parks. It particular, it was used to assess the area around Los Amigos Park in Southwest Cucamonga. The map contained crime layer/traffic collision data, a heat map, school locations, and a park walkability radius analysis layer.
Results
Ten years later, the Healthy RC team surveyed the community again, hoping to see improvements from the implemented programs. The positive results of Healthy RC are staggering.
In the first couple years, many issues were identified and policies changed. With community input, the city changed zoning so that the farmers markets and community gardens were made more accessible to all neighborhoods. The $1,500 conditional use permit fee for those amenities was waived. These were just two policy changes among many, including completing streets, setting nutrition and beverage standards, and designating smoke-free areas. Additionally, there were several infrastructure enhancements. Sidewalks and bike lanes were put into place where the need was identified, and parks were added.
As stated in a recent report, the survey showed that childhood obesity had decreased by 13 percent; the number of overweight students had decreased by 7 percent; and the incidence of heart disease, diabetes, and cancer had decreased by 20, 14, and 21 percent respectively.
The city was able to use geographic information system (GIS) technology not only to identify areas where government involvement was needed but also to make that intervention relevant and engaging to a community.
Staff used an ArcGIS Story Maps app to help people visualize and understand the policy changes. It included maps depicting areas before and after zoning changes. It also contained images showing how the addition of sidewalks and parks was changing the built environment.
Currently, one-quarter of Rancho Cucamonga's population is actively engaged in the Healthy RC program. The city has plans for expanding it citywide through community engagement to also address health equity. The revised program will include strategies to ensure adequate representation of the city's diverse population for shaping future policy, projects, and services.