USER STORY
Using ArcGIS for NPDES Program Support
By: Charles Walsh, Teddy Hailegeberel, and Patrick Callahan—Office of Information Technology, Prince George's County
The National Pollutant Discharge Elimination System (NPDES) permit program, created in 1972 by the Clean Water Act (CWA), helps address water pollution by regulating point sources that discharge pollutants to waters of the United States. As part of the NPDES municipal separate storm sewer systems (MS4s) permit, the Maryland Department of the Environment (MDE) is required by law to report storm water management and watershed restoration activity. Multiple agencies in the county, supported by various consultants, work together to ensure storm water management compliance, as well as planning and executing water quality projects to improve watershed health in Prince George's County. As part of this program, Prince George's County is required to track storm water management facilities installed within the county. These facilities are known as best management practices (BMPs).
The Need for Coordination
Each agency and consulting firm had their own version of the data; however, there was no consistency across datasets, and there was no standard or requirements for sharing and updating data on a regular basis. The reporting template was a written narrative and a geodatabase that consisted of various related feature classes and associated tables, which made it difficult for teams to organize their data as needed.
To effectively coordinate between various county agencies and public stakeholders to meet permit conditions, as well as produce a comprehensive annual report, it was obvious that the county needed to develop a central geodatabase that would support the various stakeholders' workflows, standardize data collection and data entry, perform summary analytics to track permit compliance, and allow for the MDE geodatabase to be updated on an annual basis to submit.
Implementing Change
The Prince George's County Office of Information Technology GIS (OIT-GIS) team and the Stormwater Management Division of the Department of the Environment (DoE) envisioned a solution that incorporated an enterprise geodatabase and various geographic information system (GIS) technology-based applications. OIT-GIS and DoE requested that Esri take part in a needs assessment to identify the gaps in data collection, reporting, and analysis. A project scope was created based on the needs assessment findings. This scope was divided into phase 1 and phase 2. OIT-GIS and DoE worked with stakeholders and county administration to push the project forward with Esri as the consultant. OIT-GIS and DoE worked with Esri to design an enterprise geodatabase and used the data model that incorporated elements from the MDE geodatabase as well as various county agencies, consultant datasets, and water industry best practices. The result was the Enterprise Stormwater Management (ESM) geodatabase, where all stakeholders can enter data and see the other stakeholders' data. This eliminated the need to reconcile data differences between agencies, consultants, and the annual MS4 report. The data was also used in four different operations dashboards designed for decision-makers to visualize watershed restoration summaries. The OIT-GIS and DoE also worked with Esri to configure over 60 ArcGIS Data Reviewer checks to ensure data accuracy and expedite the QC process.
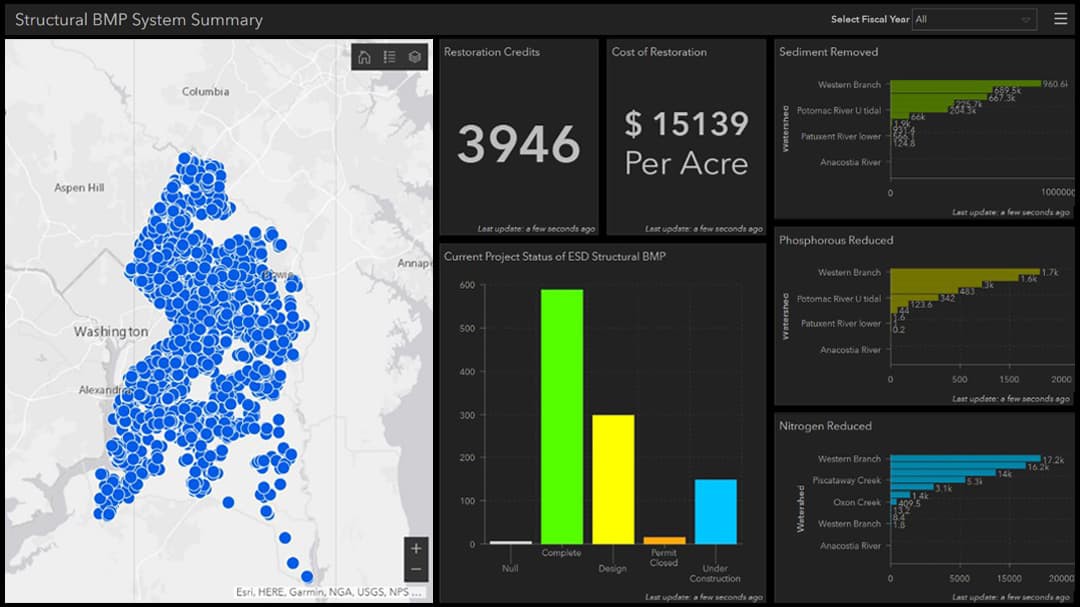
 The OIT-GIS and DoE worked with Esri to create four operations dashboards that summarize the effectiveness of BMPs in the watersheds and one that summarized the status of the BMP Inspection Workflow.
Identifying Needs
A gap was identified between data collection and entry and reporting planned and completed BMPs, as well as the triannual inspection of completed BMPs. To bridge this gap, the OIT-GIS and DoE worked with Esri to develop two workflows using ArcGIS Workflow Manager. These workflows were used to capture data for BMPs installed by developers. They also supported triannual inspection of storm water management facilities. Using these workflows (the Developer Workflow and the BMP Inspection Workflow) enabled all users to contribute to the database without having to do extra work by collecting data on their own and having that data entered into another database.
The Developer Workflow captures water quality and flood control data from the approved concept plan, to grading permit, to as built in various feature classes. Once the facility has an as-built, the workflow notifies the appropriate agency for the triannual inspection program, based on attributes in the feature class.
The BMP Inspection Workflow tracks BMP inspections, reinspections, and compliance issues and alerts enforcement agencies when necessary. The workflow allows administrators to assign BMP inspections as jobs to inspectors. This helps keep track of which inspectors are assigned to inspect which BMPs, the number and status of inspections throughout the reporting year, and which BMPs need to be scheduled for inspection every year.
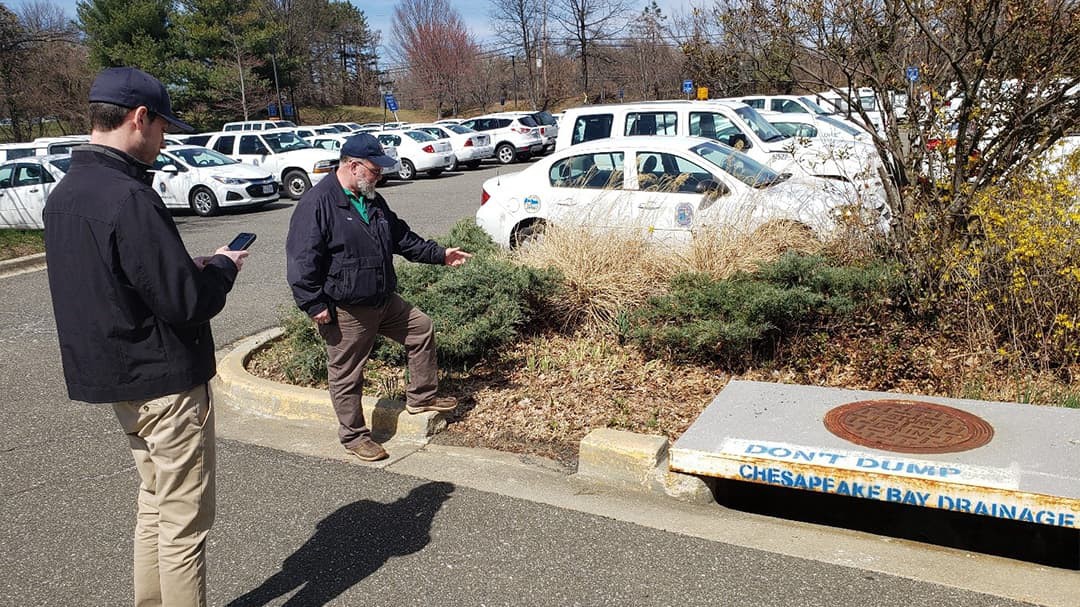
 Picture of inspectors in the field inspecting a stormwater management BMP
The county worked with Esri to create a BMP Field Inspection web map. This web map enabled ArcGIS Collector and ArcGIS Survey123 to be used to collect inspection data. Inspectors had been collecting data in the field with paper forms and cell phone cameras, then manually entering inspection information into a database and downloading their photos into folders on their network. The forms in Survey123 were modeled after the paper forms the inspectors had been using.
A few of the many benefits of the BMP Field Inspection web map and using field applications (ArcGIS Survey123 and ArcGIS Collector) include the following:
- Inspectors are no longer using paper forms in the field.
- The Collector app can be used with a phone, tablet, or computer.
- The Collector app can be taken offline where inspectors can use their mobile devices without needing network connectivity.
- Inspectors can take voice-to-text inspection notes.
- Inspectors can take pictures with a device camera.
- Inspection results upload directly to a Survey123 cloud database, which can be consumed for analytics.
- The web map consumes data from the ESM geodatabase to provide the inspectors with all the up-to-date data they need to perform their inspections.
"Collector and Survey123 have streamlined our data collection process and give us real-time analytics on the condition of our assets for regulatory purposes and program performance."—Paul DeSousa, Unit Supervisor of Inspections and Compliance Section, Stormwater Management Division, Prince George's County Department of the Environment.
"With this new system, a centralized geodatabase and summary web map applications have streamlined our reporting process and given us a better understanding of our progress toward NPDES permit compliance."—Jerry Maldonado, Section Head of Environmental Programs, Stormwater Management Division, Prince George's County Department of the Environment.
Bringing It All Together
Once all the storm water management and watershed restoration data was in an enterprise geodatabase, the county was able to publish the layers as feature services and create a BMP system map. From this published dataset, the web map enables non-GIS users to access the data for individual records and summary reports.
Using the web map application, users can sketch vector images, filter features, generate summaries for BMP features based on extent, locate based on feature attributes or address locators, generate CSV reports using polygon layers or user-drawn locations, and print maps to PDF.
These web maps have decreased the need for stakeholders to constantly request data from GIS staff and reduced misinformation since the ESM geodatabase is now the authoritative source for the data.
The field collection applications have saved time and improved data quality since the data is no longer being collected on paper at the site and manually entered into the database in the office.