ANALYZE DATA IN CONTEXT
Location reveals hidden patterns and relationships
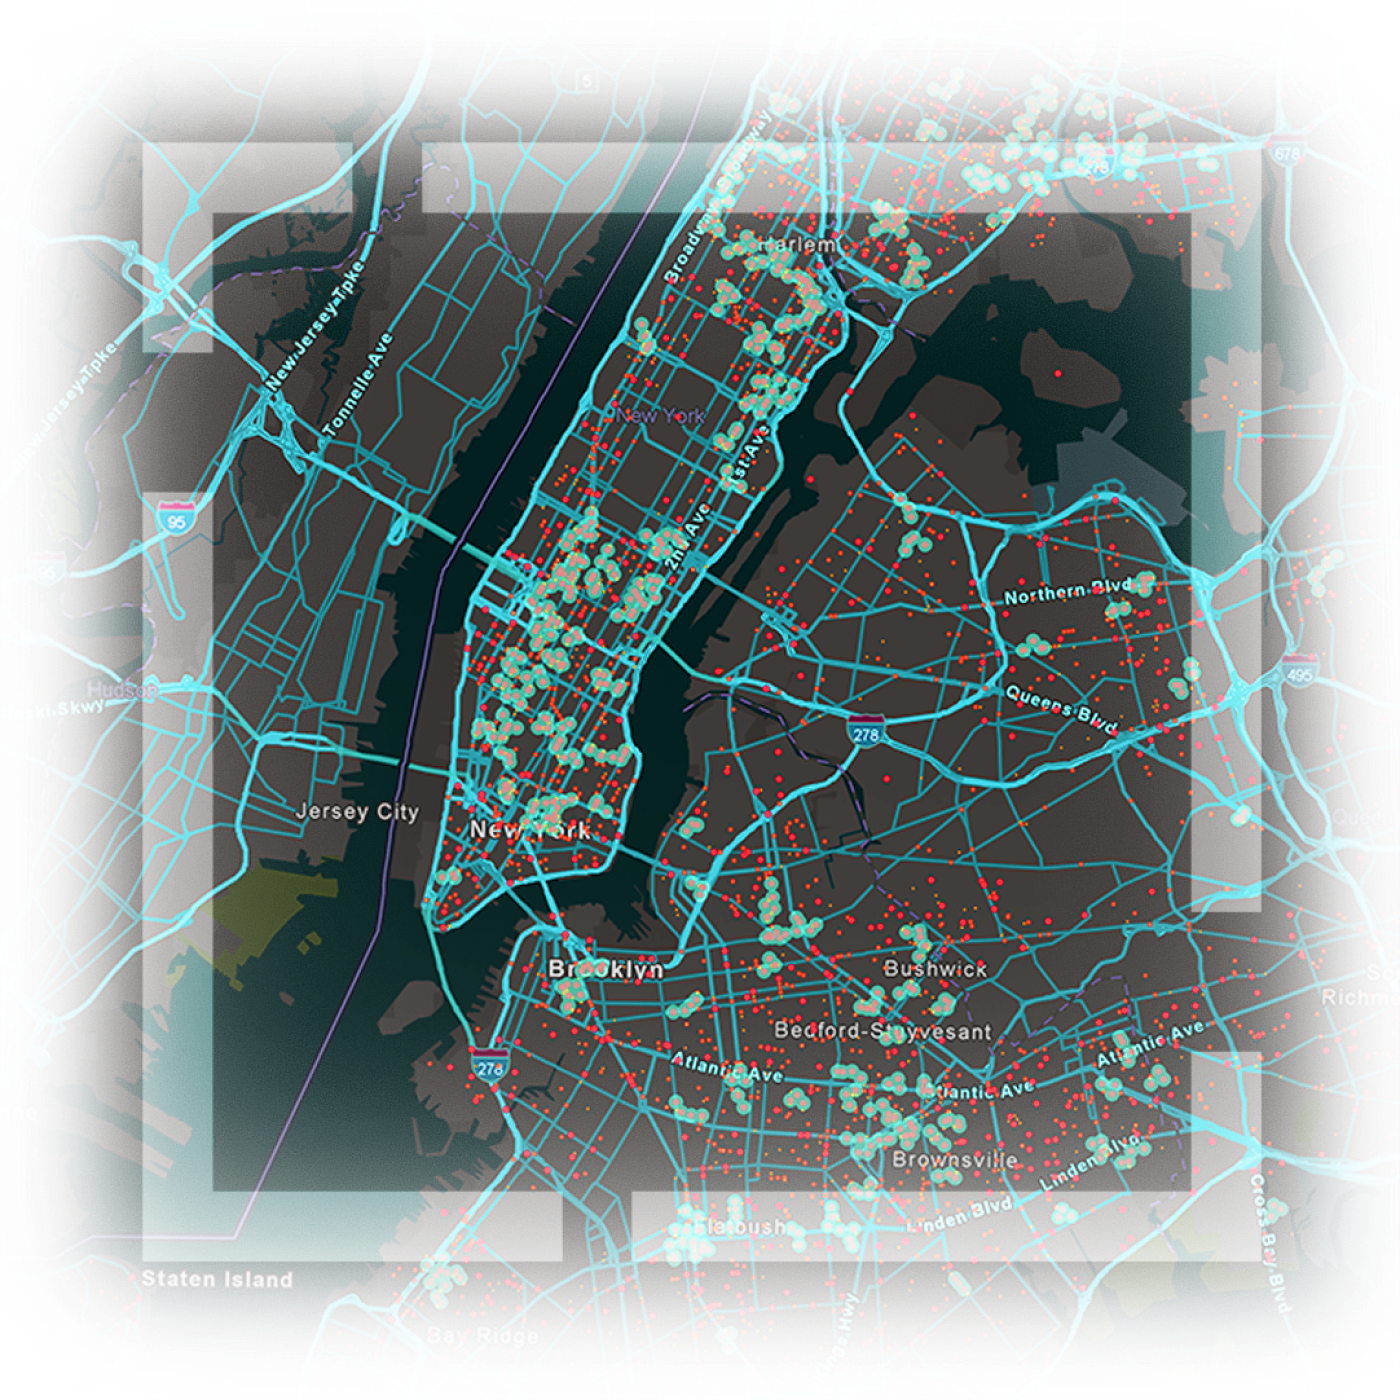
Spatial analytics uses location as a connective thread to help you understand how the environment around you affects the challenges you're finding solutions for—whether that is climate change, customer behavior, or resource allocation. By examining data in relation to its geographic location, you can reveal unexplored spatial patterns, trends, and connections. It's these essential discoveries that often explain the "why" behind many of today's most pressing environmental and business questions.
Unparalleled collection of spatial algorithms
Esri continues to evolve to meet your needs with a comprehensive set of spatial algorithms and methods ranging from basic to advanced.
Enterprise-grade analytics
Business and government leaders around the world rely on Esri to maintain operations and provide technical support when it’s needed the most.
Align with data governance strategies
Seamlessly store, manage, and integrate geospatial data from multiple sources, ensuring a smooth data exchange and software interoperability.