Within the last two years, we've gone from GIS being a place where you get requests for maps during an event to a group that's proactively sharing information and situational awareness with ArcGIS Dashboards.
user story
Raleigh Enhances Situational Awareness for Emergency Response with Operational Dashboards
From tornadoes to floods, hurricanes, and snowstorms, the entire state of North Carolina has been impacted by natural disasters that cause power outages, property damage, disruption to food and water supplies, and injuries and fatalities. The Emergency Management Office of the City of Raleigh, the state's capital, is committed to protecting residents by coordinating disaster planning efforts; assisting with the integration of emergency plans; and ensuring information flow to the public before, during, and after major emergencies or disasters.
To strengthen emergency response and recovery efforts, the Emergency Operations Center (EOC) recently renewed its focus on situational awareness. The Emergency Management team partnered with the city's geographic information system (GIS) team in developing tools and technologies to provide mission-focused, real-time insight. Headed by the city's emergency management office, the EOC acts as a command center to coordinate emergency response and is responsible for increasing visibility and providing situational awareness throughout an emergency event.
Providing situational awareness includes sharing information on service requests, on-the-ground observations, sensor readings, predictions, and resource deployment. In addition, the EOC aims to provide crucial details regarding emergency events to keep the public informed and safe.
The City of Raleigh's GIS team implemented a new solution that leveraged the investment in their existing ArcGIS platform. This allowed them to develop operational dashboards, giving the EOC command team real-time data and easily viewable information in one place.
Challenge
The EOC command team is responsible for coordinating response efforts among different groups in an emergency event. These groups include the fire department; first responders; law enforcement; and tactical operational response teams from parks, transportation, and engineering services. As such, real-time data is crucial to help first responders answer requests, dispatch necessary resources, and deploy emergency personnel.
User
Raleigh, North Carolina
Challenge
Getting real-time data in one place in order to coordinate emergency response efforts
Solutions
ArcGIS Dashboards
Results
Several customized dashboards for the Emergency Operations Center, improving overall emergency management and response
However, an ongoing challenge for EOC staff was getting the real-time data they needed to coordinate resources and increase visibility into the overall management of the emergency event. Additionally, the command team wanted all information available in one place, presented in a way that's easy to understand and interpret for fast, accurate decision-making. The existing process involved the EOC reviewing multiple sources for information.
"[Without information] available in one [place], the EOC must have many different screens with six different pieces of information, which then can take away from the amount of work that [staff] can do," says Kristyn Young, senior enterprise GIS administrator for the City of Raleigh.
Often, staff had to manually record important data about natural disasters, such as the wind speeds of a hurricane. The new solution needed to give the team the ability to quickly add data and provide information faster to emergency personnel.
The GIS team was asked to develop a tool to provide the EOC with real-time insight and information at a glance. Given this goal, the team began development of an emergency management suite in preparation for the 2018 hurricane season.
Solution
In early 2018, the city's GIS division connected with Esri to explore emergency management solutions for situational awareness and incident management. They selected ArcGIS Dashboards, a configurable web app that allows for the dynamic display of data and analytics.
The GIS team chose ArcGIS Dashboards for its ability to incorporate visual elements like charts and maps for an operational view of people, assets, and events in real time. Also, the GIS team was already proficient with the Esri suite and believed ArcGIS Dashboards would be easy for them to learn.
Young created several customized dashboards for the EOC and implemented the solution just one week before the devastating Hurricane Florence struck the state in September 2018. The dashboards displayed relevant, real-time information such as where debris was located for cleanup or how many unresolved calls there were from city residents.
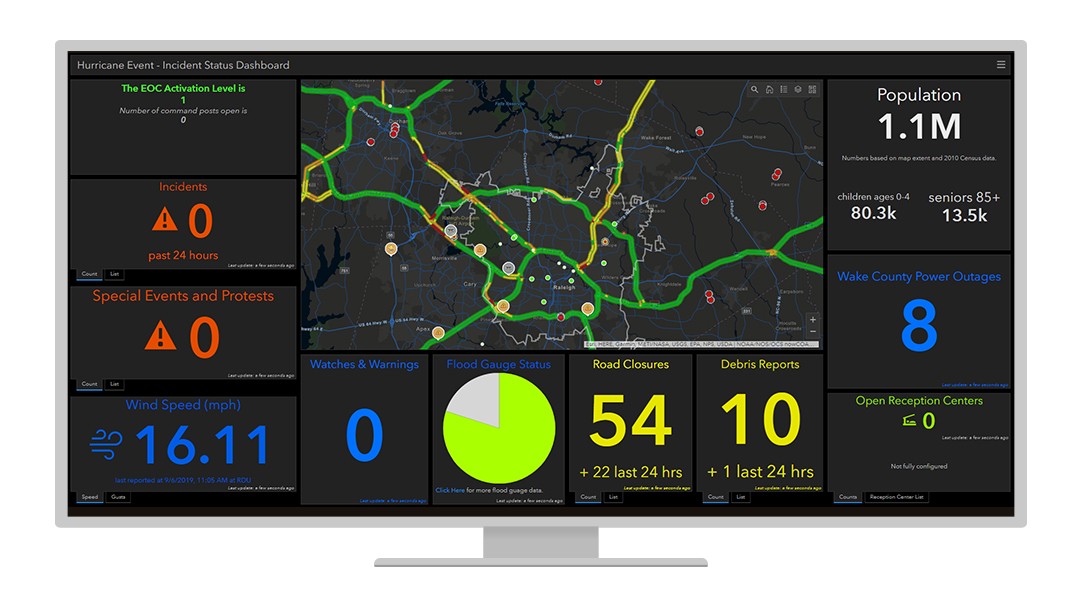
 During a hurricane event, an incident status dashboard such as this one shows active incidents and events, as well as road closures and debris reports.
Young notes that ArcGIS Dashboards was easy to use with virtually no learning curve, adding that the team "was able to just pick it up and create what we needed to, and the implementation was pretty seamless." In the course of 36–48 hours during Hurricane Florence, the EOC had gone from zero dashboards for emergency management to four or five, including one dashboard that gave visibility to the emergency management command staff and one that was for the public.
According to Jim Alberque, GIS and emerging technology manager for the City of Raleigh, the dashboards created by Young revolutionized what was happening in the EOC.
"We probably had 30 screens in the EOC and most had an operational dashboard on it, whether it was an internal incident information dashboard or our nonemergency call center dashboard," says Alberque. "People were pretty riveted to see what was being shared in real time through those dashboards."
Results
The use of operational dashboards by the EOC has transformed how information is viewed and communicated as well as improved overall emergency management and response. According to Young, the major benefit of ArcGIS Dashboards is the ability to display a lot of information at one time and in one place.
"With ArcGIS Dashboards, we're able to just display everything we need to display and then also do some minor analysis on the fly, like counting the number of incidents that are active and resolved," explains Young.
For example, if the EOC can see that there are five trees down, the ability to receive that information and then produce a map and a visual representation with ArcGIS Dashboards—and even add camera footage—allows staff to bring together all the information that somebody needs to see at the same time in the same place, says Young.
ArcGIS Dashboards functionally displays real-time data to the EOC and the public. For example, during Hurricane Florence, a staff member was assigned to monitor wind speeds, checking them every 15 minutes and writing the results on a whiteboard. With a digital dashboard, this variable was coded in, so the EOC was receiving live wind-speed records during the event.
"Now information is readily available at a moment's notice in real time on the dashboard in the main operational room. It's a huge jump from having somebody doing a manual process [of recording data] to all real-time where they need it," says Young.
"We have the opportunity to put real-time data feeds in and have it update and show that real-time information. And I think that that's one [area where ArcGIS Dashboards] is definitely beneficial," Young adds. "And when you combine that real-time power with the power of on-the-spot analysis and being able to visualize multiple things at once in different ways, it becomes this awesome, all-encompassing solution."
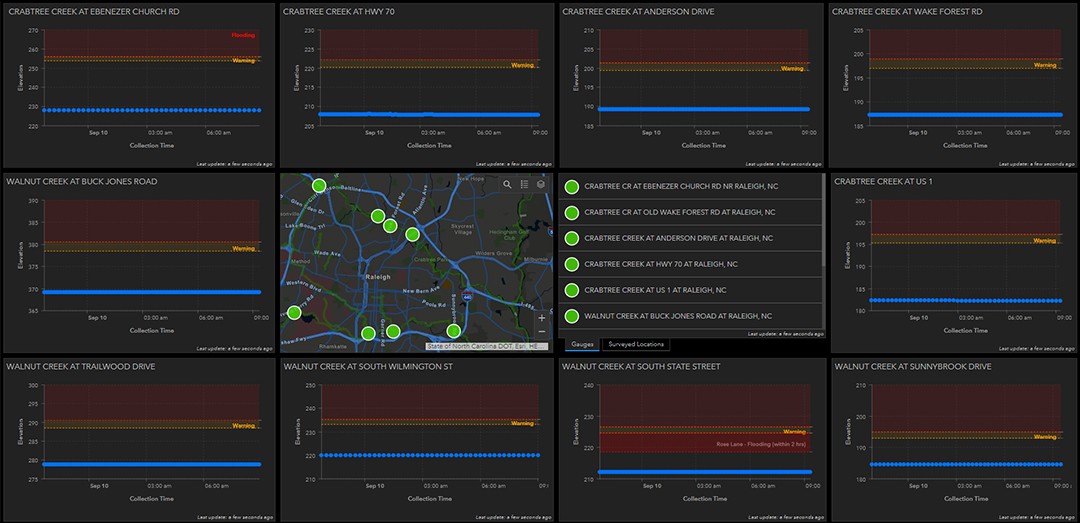
 Real-time data on the status of stream gauges is displayed in this view, helping the city determine where flooding has occurred.
ArcGIS Dashboards allows the GIS team to quickly edit information and add it to dashboards at any time and push real-time updates to emergency management personnel.
Young explains, "So when we wanted to add the hurricane wind speed, we would just update the wind speed or add a widget for the wind speed and then just go in and ask staff to refresh the dashboard, or we would refresh it for them. And then the new information was there for them."
With ArcGIS Dashboards, rapid deployment means that new dashboards are created quickly, enabling the GIS team to provide important information faster. For example, real-time information allowed them to see if it was safe for ladder trucks, power line workers, and other first responders to respond to emergency calls during Hurricane Florence.
Alberque says, "In the span of 36 hours, we were able to create several dashboards that added just immediate value to a whole bunch of units. So just on the solution development side, that cycle from just gathering requirements to solution deployment is super short."
Derrick Remer, director of emergency management for the City of Raleigh, adds, "This is extremely important during a hurricane as it allows instant access to information used to make a critical decision regarding the safety of our first responders working in the field."
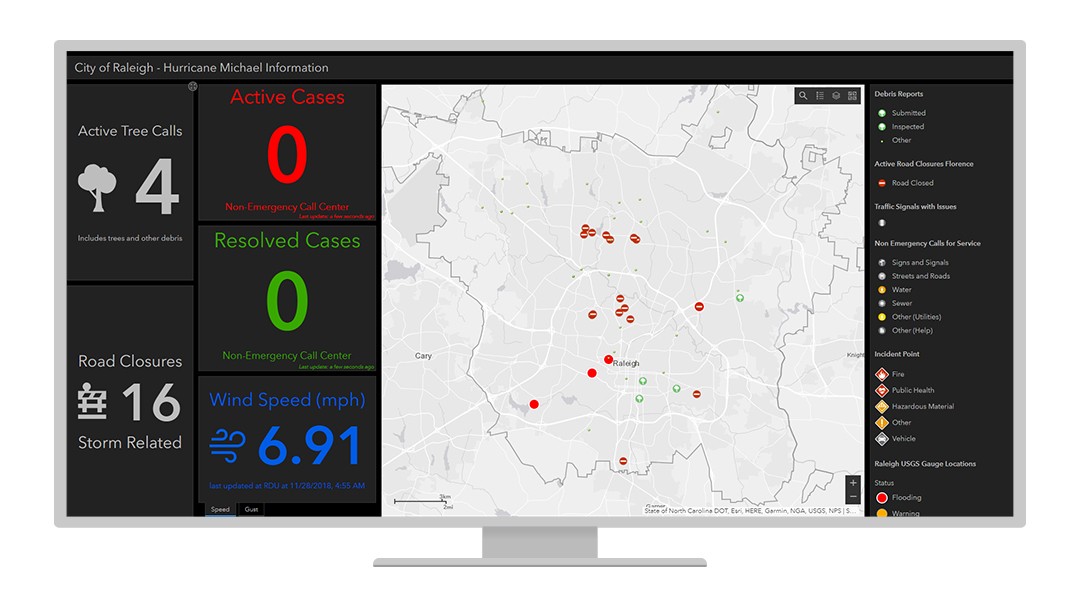
 This dashboard, created during Hurricane Michael, is another example of how information is tracked within the EOC.
The response received from the EOC, emergency personnel, and the public has been very positive, and dashboards continue to be created to better respond to emergency events and protect city residents. In 2019, the EOC dashboard was even recognized by IDC Government Insights, an organization that offers fact-based research and consulting services for government and IT. The city's GIS division was given an IDC Smart Cities North America Award in the Urban Planning and Land Use category.
"I don't believe our consumers actually know that we're using ArcGIS Dashboards. Hopefully, they just think, 'Hey, the GIS team can kind of spin up some visualizations and dashboards fairly quickly that we can access via the web.' It really is amazing technology," says Alberque.