When you’re building a wind farm, it is of critical importance that you know where everything is.
Simon Feeney
Offshore Wind Energy, Ørsted
ENERGY GROWTH
When organizations in Europe need new energy sources, GIS models the potential of new sites.
A phalanx of 165 wind turbines—each standing twice the height of Big Ben—towers over a 40-mile square of seabed off the northeast coast of England. It’s called Hornsea 2, and it’s the world’s largest operational offshore wind farm. Its massive rotors churn out enough renewable energy to power 1.4 million homes in the UK.
Offshore wind energy plays a major role in the UK’s strategy to decarbonize its energy system and achieve net-zero emissions. That makes the North Sea, with shallow coastal areas and a stable breeze, a global hot spot for offshore wind energy development. In 2021, North Sea wind capacity stood at 28 GW. Now there are plans to scale this up to 300 GW by 2050.
Hornsea 2 is one of 16 UK wind farms developed by Ørsted, a Denmark-based international clean energy company and the world leader in offshore wind. Over the last decade, Ørsted has transformed itself from a major player in fossil fuels to a global leader in green energy. Its success is due in part to its ability to navigate the complex geographic considerations involved in offshore wind operations.
When you’re building a wind farm, it is of critical importance that you know where everything is.
The promise of offshore wind comes with tough challenges. Hydrodynamic effects are intricate and challenging to predict. Tempestuous seas expose every miscalculation. Delays and inefficiencies can cost millions.
 The complete offshore wind energy infrastructure network from turbine to the home.
Development work involves pinpointing risks, assessing opportunities, and understanding limitations—all of it done with precision. “When you’re building a wind farm,” said Simon Feeney, Ørsted senior chief specialist for offshore wind energy, “it is of critical importance that you know where everything is.”
That knowledge of where everything is, precisely, gives wind developers the lens they need to organize and understand the hundreds of factors at play. It’s a matter of matching data to geography. At every stage of development—from initial design to construction to ongoing operation and maintenance—Ørsted’s project teams leverage a geographic information system (GIS) to drive decisions and coordinate across the company.
The development of a wind farm typically starts by assessing the revenue potential of prospective lease sites. “It is extremely important in our world to have accurate estimates of how much all of our wind farms will produce,” Feeney said. Developers pore over GIS maps layered with market data, supercomputer-generated wind models, and meteorological data from weather stations and buoys.
Some considerations are exceedingly complex. As turbines turn to extract energy from the wind, they create a wake of slower-moving air behind them. This can influence power predictions and must be considered to ensure an accurate estimate of the energy a wind farm will produce.
This phenomenon, called wake effects, makes it crucial for developers to also keep tabs on competitors’ leasing and building activities. Nine different countries are involved in North Sea wind development, each adding its own layer of complexity to the regional dynamics.
“It’s a huge dataset with a lot of different assumptions,” Feeney said. “We map it out to keep track of where [wind developments] are, and when they will come online. There is really no other way to do it.”
 Location technology is used to monitor wind patterns, turbine health, maritime traffic, and environmental conditions.
Other data types layered on maps identify places where development might be risky. Geophysical surveys of the seabed, for instance, reveal areas with challenging water depths or unsuitable conditions on the ocean floor.
Using modeling techniques, developers can simulate the long-term impacts of ocean currents and sand waves on turbine towers. They can trace shipping lanes, fishing zones, marine protected areas, and places where World War II ordnance presents a hazard.
All of it leads to better planning. Hundreds of kilometers of cables connect wind farms to the energy grid—and every meter must be properly routed. “We are looking at risks associated with different areas of seabed or land use, and whether they will create construction challenges or high costs,” Feeney explained.
As projects move from design to construction, GIS maps and dashboards streamline handoffs and knowledge sharing between teams.
Measuring the angles for inter-array cables, for example, requires precise calculations to drill a secure attachment. “Previously, we had to manually calculate the angle for each hole,” explained Georgina Smith, Ørsted senior GIS specialist. She and her team created a custom GIS tool that automates this measurement for construction crews. “This has helped bring uniformity to our process.”
 A map of Hornsea offshore wind farm projects in the North Sea, off the Yorkshire and Norfolk coastlines, UK.
Long-term construction operations—like the burying of subsea cables—are tracked with a GIS application. A dashboard highlights areas for installation teams to revisit as quality assurance.
Bad weather, port backups, and supply chain issues can seriously disrupt wind farm operations. To stay ahead of potential impacts, construction teams and office personnel share real-time GIS dashboards with vessel locations, status updates, and weather information.
If a turbine malfunctions, operations teams can quickly send repair vessels with precise coordinates, performance data, and alarm codes. Crews would already have the best routes mapped out and could see any obstacles or conditions they’ll face.
“With GIS, we can provide all of this data in a meaningful context,” Feeney said. “It is a powerful way to work.”
Before departing for routine or preventive maintenance, crews sort and filter inspection data on GIS maps to optimize routes and combine nearby tasks into single voyages. “We were able to significantly reduce the number of trips our vessels make,” Smith noted, “which not only cuts down on fuel consumption but also saves valuable time for our team.”
No two wind projects are the same, which challenges developers to adapt and innovate, drawing on lessons learned from past projects. “We invariably encounter specific requirements that demand tailored solutions,” Smith said. “GIS helps us manage the complexity.”
Explore more examples of how leaders in business and government are using GIS to enhance analysis, operations, and decision-making.

URBAN PLANNING
When cities plan for the future, GIS models changes in population, risks, and land use to help leaders analyze the best ways to serve communities.
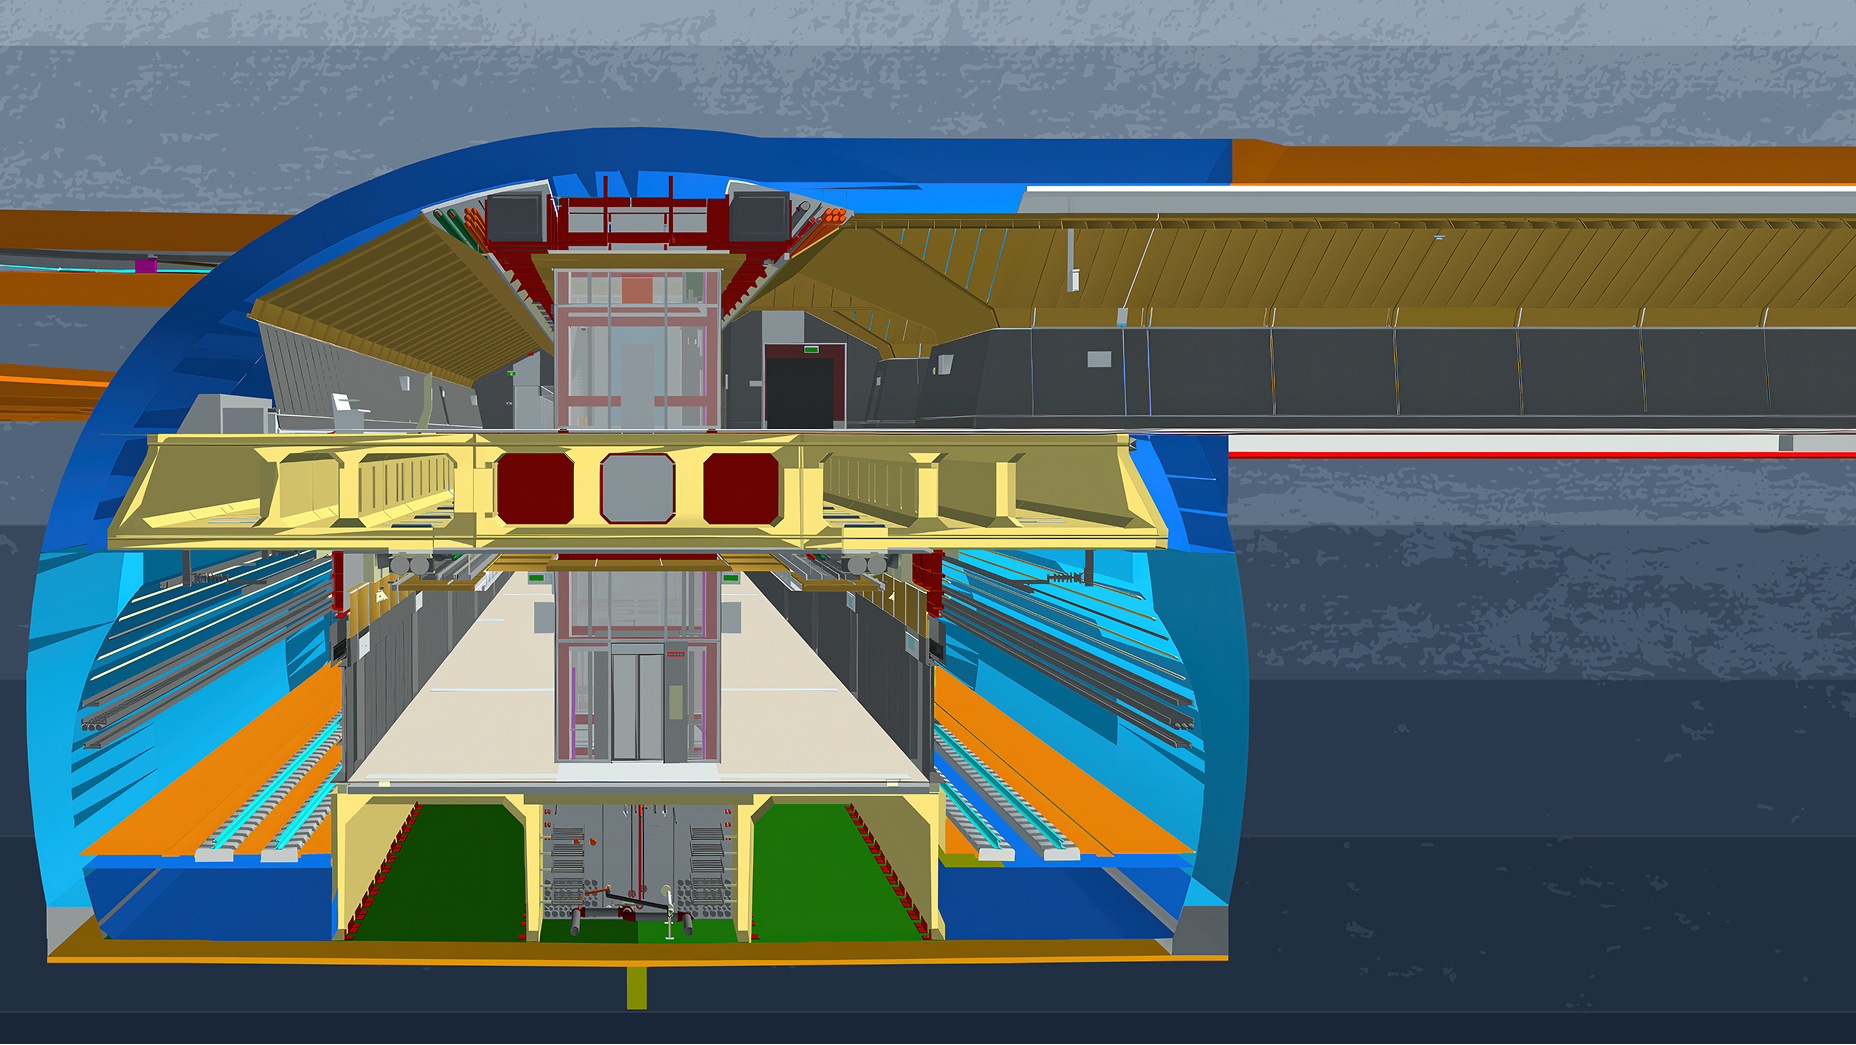
INFRASTRUCTURE
When planners need to build or modernize infrastructure, GIS models a shared, real-time view of project designs, challenges, and progress.
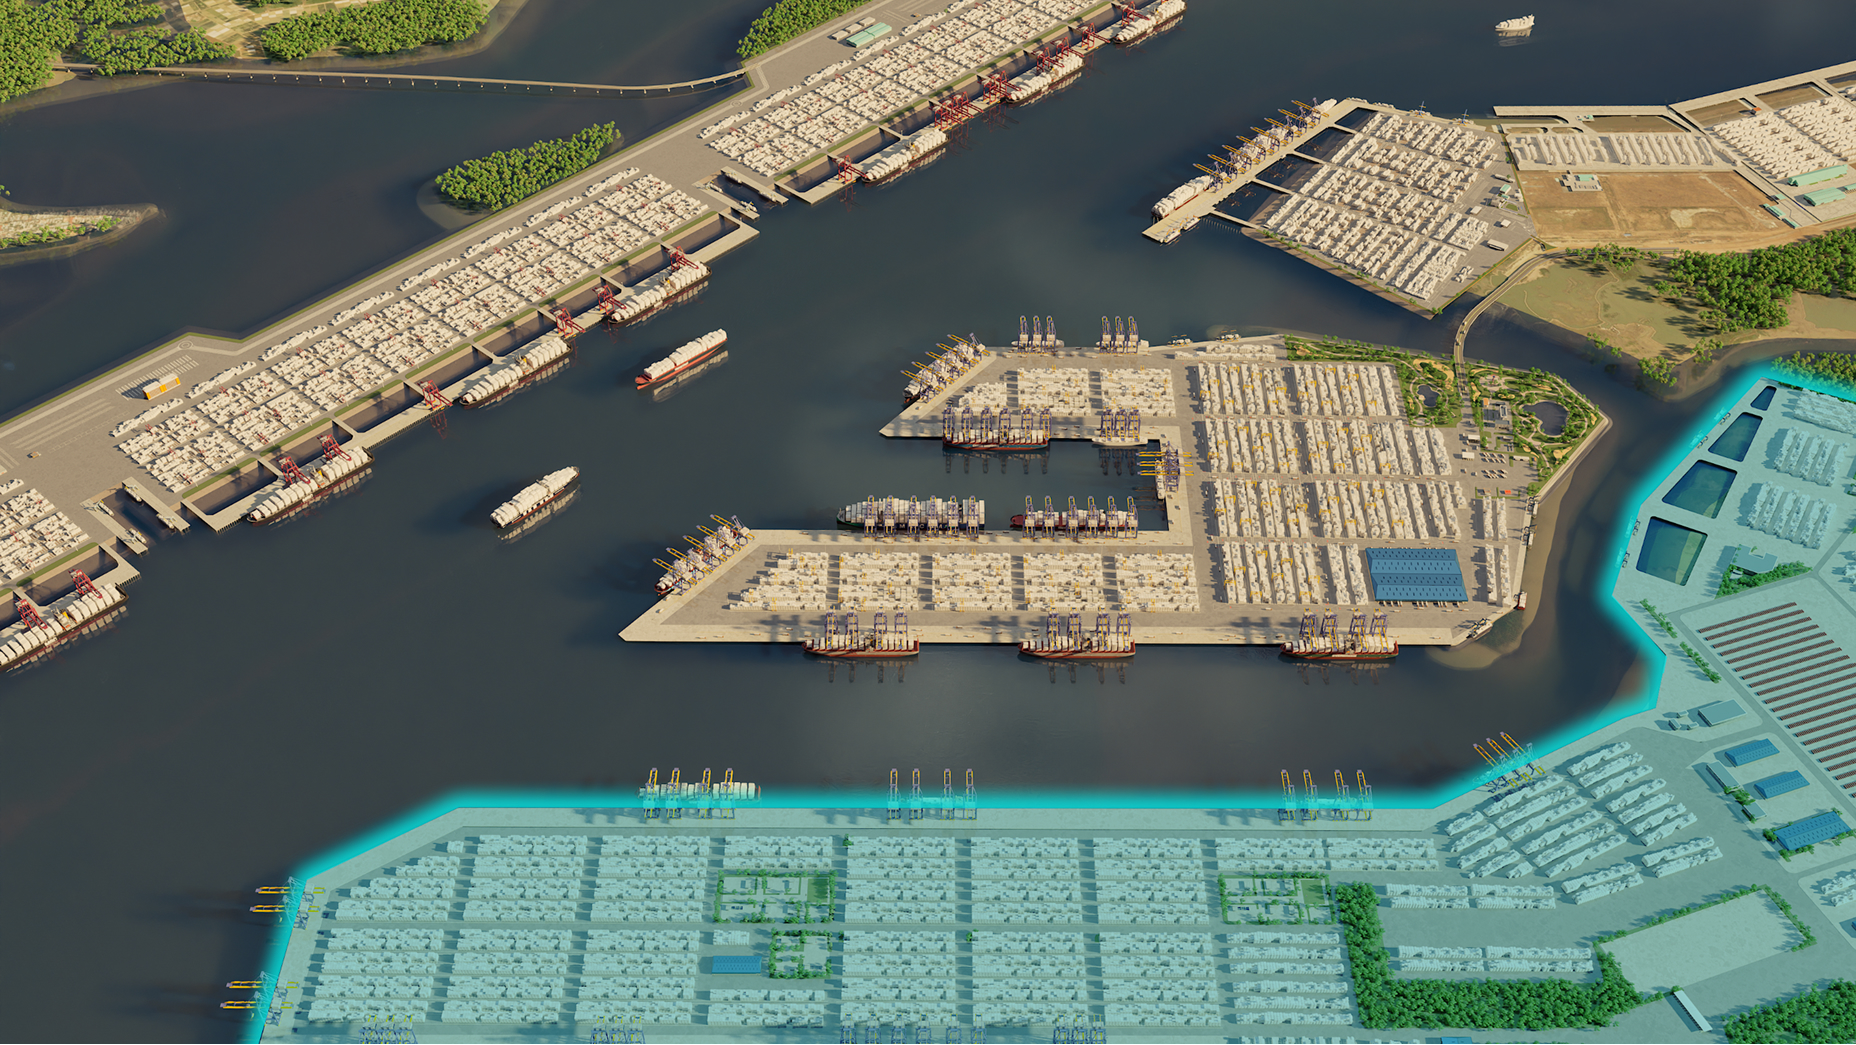
LOGISTICS
GIS-powered digital twins guide port expansions to meet growing economic demand and keep global supply chains moving.
Learn more about the products used in this story
Discover geographic information system (GIS) technology, the mapping and data analysis software that’s powering business decisions, supporting government operations, and quietly changing the world.