
Such a massive program requires a dedicated information system.
Thomas Plantier
Director of Digital Transformation, Cerema
INFRASTRUCTURE
Governments across Europe are rushing to modernize aging bridges—triggered by decrepit infrastructure conditions and increased instances of collapse. France faces a distinct challenge: More than one-third of the country’s bridges are coming due for major repairs or replacement.
“We’ve been dramatically reminded in recent years of the extreme sensitivity of road bridges,” said Thomas Plantier, director of digital transformation at the Centre for Studies and Expertise on Risks, the Environment, Mobility and Urban Planning, or Cerema. “With the 2018 collapse of the Morandi Bridge in Genoa, the French government recognized the need to survey and assess the condition of France’s bridges.”
 A bridge undergoing extensive repair.
At that time, France lacked a national program to evaluate bridge conditions. With over 36,000 road authorities, including many smaller municipalities with limited resources, the challenge was immense. So how did the French government assess tens of thousands of bridges on an urgent timeline? They empowered field agents and decision-makers with advanced mapping technology.
Such a massive program requires a dedicated information system.
The government’s newly created National Bridges Program, led by Cerema, coordinated 250 agents from 30 different contractors. The initial phase involved 11,500 municipalities. They had 6 months to prepare and 18 months to complete the census. “Such a massive program requires a dedicated information system,” Plantier said. Cerema chose a geographic information system (GIS) because it provides the mapping capabilities they needed plus mobile survey tools, data management, and visualization.
Field teams were able to collect data, including locations and images, often offline. Office staff had access to a secure database, a public map, and a health diary of each bridge and its associated retaining wall. Management could use dashboards to visualize and monitor progress.
 An interactive map shows bridge and retaining wall locations and construction details.
In the first phase of the project, 250 field agents surveyed 45,000 bridges and retaining walls. All data was tracked and progress shared via dashboards. This helped teams quickly pinpoint the structures most urgently in need of repair.
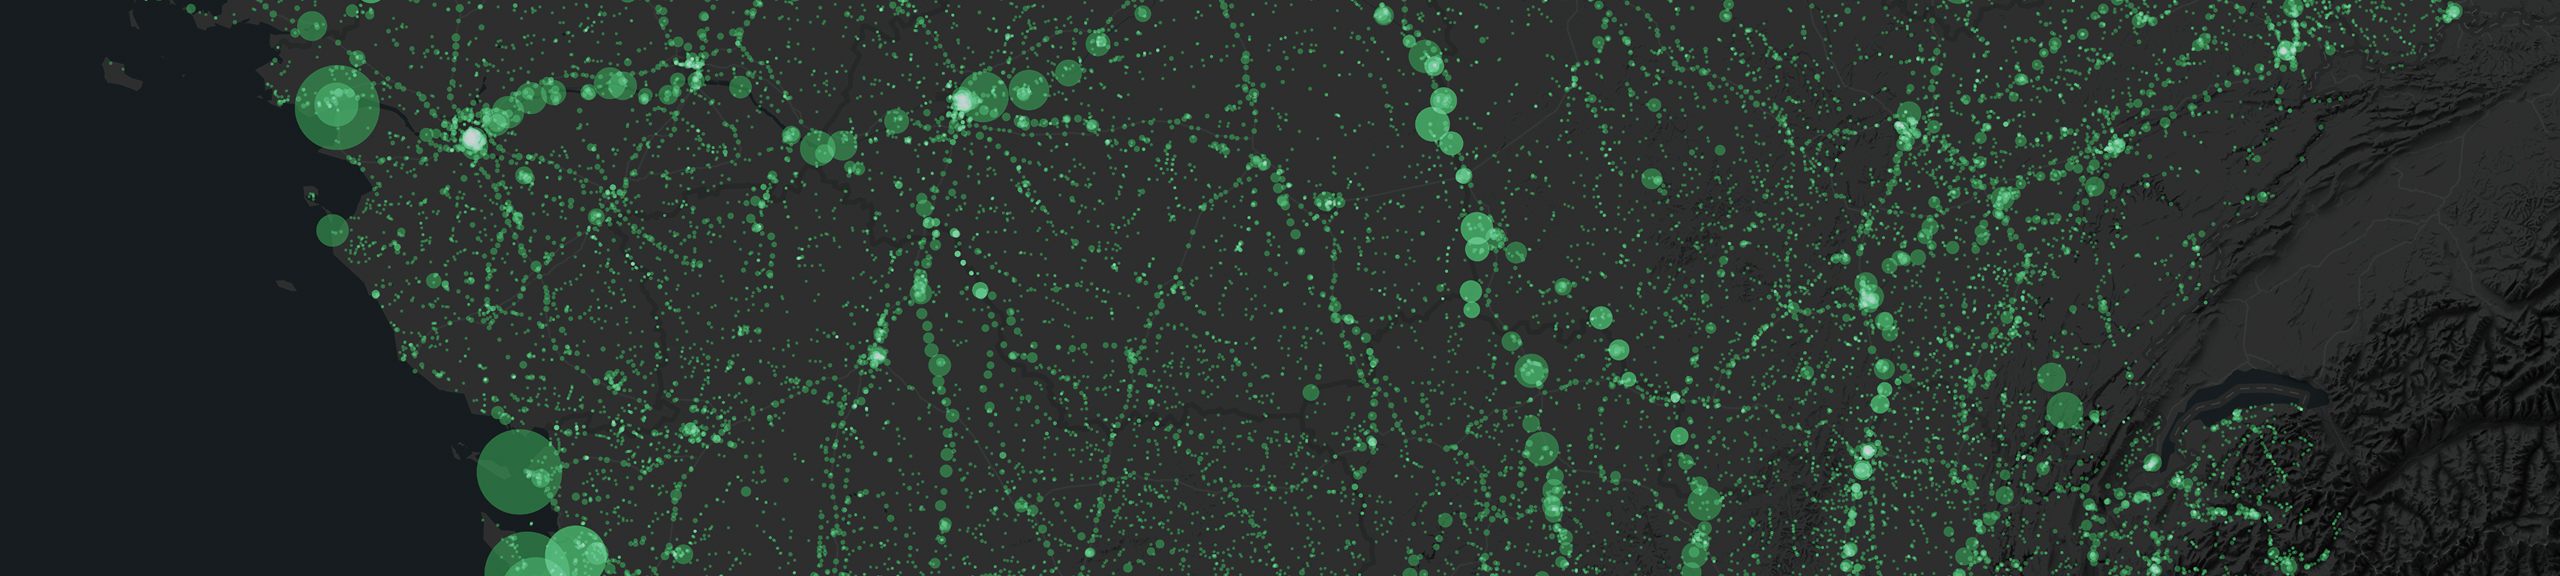
Cerema’s initial census delivered a comprehensive view of conditions for thousands of bridges and retaining walls nationwide. An interactive online map made the data accessible to the public.
The assessment revealed that 10 percent of surveyed structures required immediate attention to ensure public safety, and 21 percent needed significant repairs. Renovations are already underway. Cerema has also created guides to help local authorities maintain bridges going forward. In April 2023, the government extended bridge census efforts through the National Bridges Program. An additional 3,200 municipalities joined, bringing the total to nearly 15,000 in mainland France (including Corsica) and 43 in overseas territories.
The total number of structures surveyed now includes 40,855 bridges and 22,602 walls in mainland France, plus 434 bridges and 113 walls overseas.
“The data-driven and map-focused results of the National Bridges Program has helped solidify the role of Cerema as the authority on bridge and infrastructure quality,” Plantier said. “That data-driven effort, using GIS-based surveys, is a pattern we plan to apply for other initiatives.”