As the city moves forward with modifications to land use, we will definitely continue to present data by using ArcGIS StoryMaps to show the justifications for proposal changes. This project illustrates the importance of data and spatial analysis as well as how telling a story with spatial data can have a real impact on our community.
user story
City of Tacoma Streamlines the Strategic Planning Process to Address Affordable Housing and Housing Inequalities with GIS
Tacoma, Washington's third-largest city, is facing a housing crisis amid rapid population growth. City officials recognized that the lack of affordable housing continues to affect lower-income and historically marginalized communities from securing a place to live. Over the last year, the economic impact of the COVID-19 pandemic has resulted in even more residents experiencing financial hardships. From 2010 to 2019, the region added three new residents for every new housing unit. This challenge has moved city officials and the planning department to address inadequate housing supply and increase housing affordability for the Tacoma community.
To respond to the affordable housing crisis, the city created Tacoma's Affordable Housing Action Strategy (AHAS). This strategy addresses challenges such as the lack of affordable housing for vulnerable communities and the scarcity of housing assistance resources and proposes solutions for low-income residents to secure housing. In 2020, the city initiated further action that would prioritize public engagement and feedback on the AHAS, with a deadline of six months. This led to the creation of the Home in Tacoma Project, built using ArcGIS StoryMaps, an interactive storytelling application. This project-focused approach educated the community about the benefits of diversifying housing types; the history of redlining, a discriminatory practice that made it difficult for people of color to become homeowners; and how the city is revisiting previous housing policies.
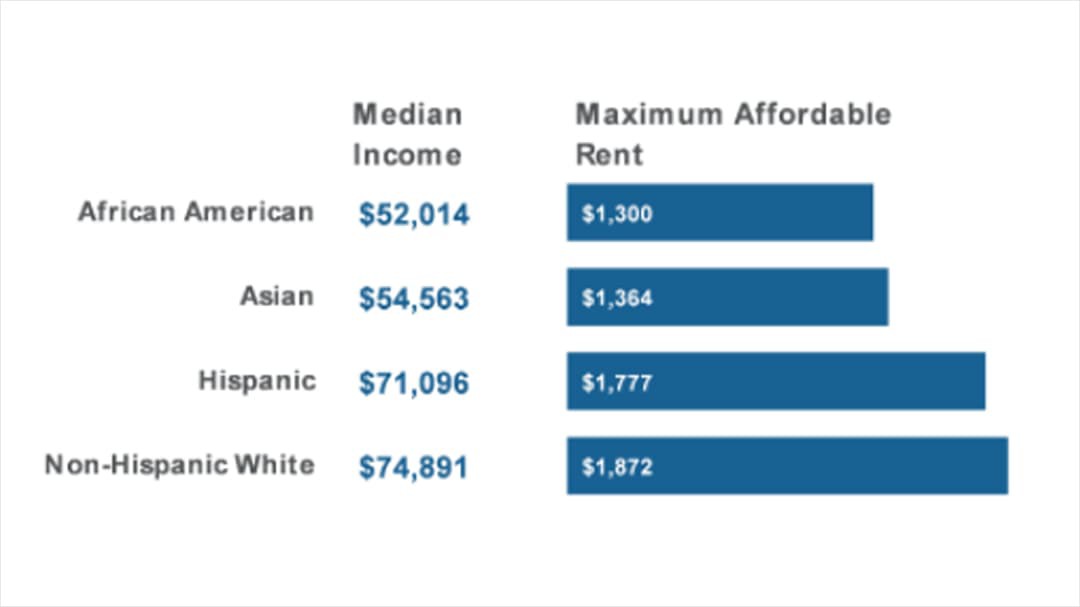
 Tacoma Median Income and Affordable Rent by Race and Ethnicity
"When people hear the phrase affordable housing, they tend to imagine their neighborhood changing for the worst, with inappropriately sized apartments looming over their house. But Tacoma's strategy is about creating a strategic and inviting mix of housing types," says Christina Chelf, GIS supervisor at the City of Tacoma.
Chelf and her team, including Adriana Abramovich and John Shell, decided to lead with a geospatial approach as the most efficient and user-friendly tool to expedite the process of sharing information with the community. They created an application with interactive maps and a narrative to inform residents about the city's need to address its housing challenges and promote equitable, affordable housing solutions for all.
"We needed to show residents the benefits of diversifying affordable housing types across the city. We created an ArcGIS StoryMaps [story] that presented the urgent need for housing supply, addressed misconceptions about what a community with more diverse housing types might look like, and showed the historical housing inequities in the region and their enduring consequences," states Chelf. "This online tool helped us to quickly streamline the process of creating and sharing a new housing strategy with our community."
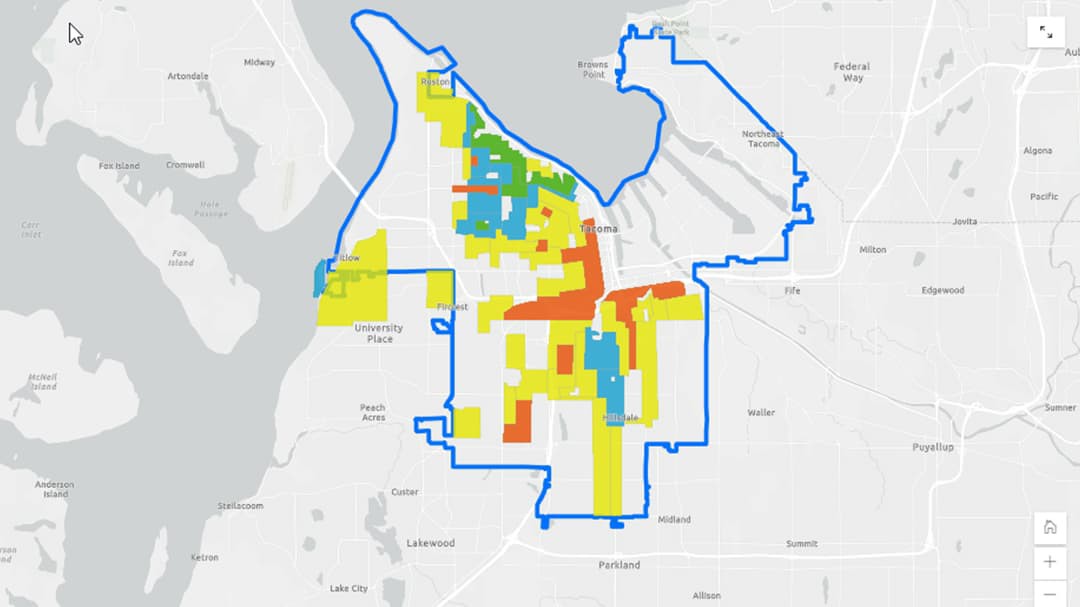
 This map displays historical documentation comparing which areas experienced redlining with those whose population had greater access to affordable housing.
Mapping to Visualize Racial Inequities
With Tacoma's history of redlining in the 1920s, today's city officials wanted to address these racial inequities within the community. The city's planning department worked with the GIS team to incorporate maps into the Home in Tacoma Project to help residents understand the direct impact redlining had on under-resourced communities.
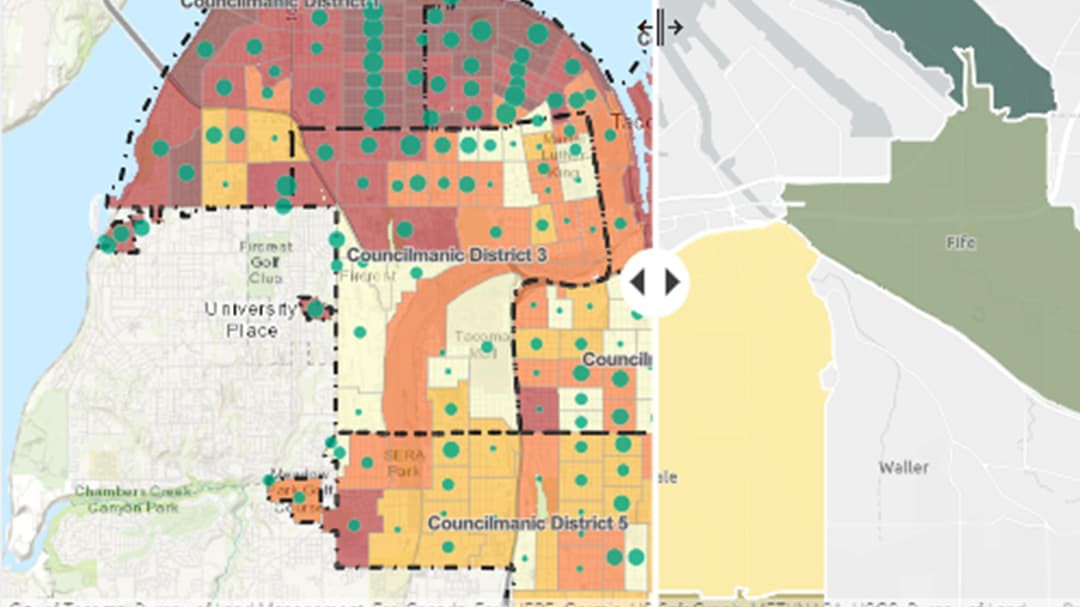
To visualize the relationship between affordability and the lack of housing, the department used the city's Equity Index map to show how historic housing policies were negatively impacting people of color. The data presented in the equity index influenced Tacoma's decision to prioritize creating more housing in areas with higher opportunity and to avoid gentrifying areas with racially diverse populations.
 Equity and housing costs slider map of Tacoma displays the overlap between residents' access to affordable housing.
The project also showed that housing costs for many residents has continued to rise while household income has remained stagnant. This has resulted in around 40 percent of residents paying more than they can afford for housing. In response to the affordable housing inequities, Chelf and her team also used the story map to educate residents on how a diverse housing mix that included duplexes, townhomes, and single-family homes would serve the community more effectively. As a result, the story map gave the public greater insight and understanding about the community's need for a revitalized housing mix.
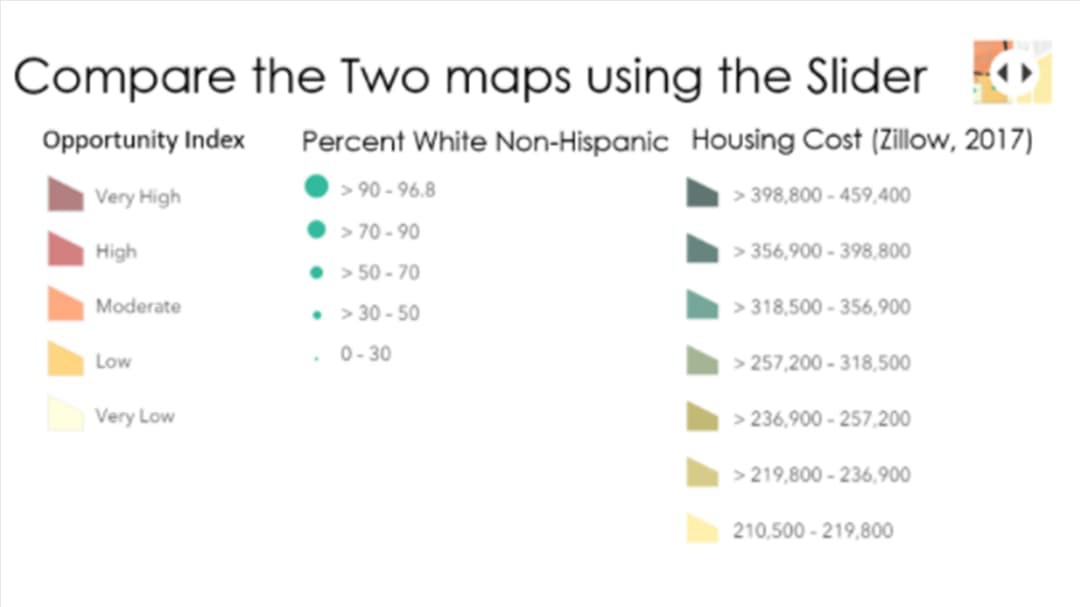
 Legend for Opportunity Index and Housing Cost
Gathering Feedback from the Community with GIS
As city staff reviewed plans for creating more affordable housing, they knew community feedback was an important part and attempted to engage with residents at every stage. Coinciding with the release of the Home in Tacoma Project, the city used an online survey to collect general feedback on the direction of the initiative. Since the launch of this story, over 800 community members have submitted their feedback on the affordable housing proposal.
Several months later, as the city began reviewing more specific future land-use changes, the city's GIS team again created a tool to support the project. Using Esri's ArcGIS Web AppBuilder, an app creation tool that requires no coding skill, the team collected over 200 location-specific comments on the Home in Tacoma Growth Scenarios map in just a few short weeks. The comments will be used to guide the final proposed change.
Future Plans for Regional Collaboration
While the City of Tacoma continues to gather valuable feedback from the community, the GIS and planning departments are collaborating with regional partners to explore affordable housing solutions regionally. Based on a regional analysis, they know they will need to increase housing units by 60,000 dwellings by 2040 to meet the demand of population growth. GIS technology will remain ingrained in the city's housing strategy to ensure that Tacoma continues to understand the community's needs, create programs based on data and analysis, and prioritize equity.