Case study
EAC Creates COVID-19 CommonHealth Data Map
Home to 177 million people, the East African Community (EAC) is a regional intergovernmental organization consisting of six country states: the Republics of Burundi, Kenya, Rwanda, South Sudan, and Uganda, and the United Republic of Tanzania. Members of the EAC work to strengthen economic, political, social, and cultural integration to improve quality of life for the people of East Africa.
Part of EAC's work in 2020 included monitoring the impact of COVID-19 throughout the region. The EAC turned to The Commons Project (TCP), a nonprofit public trust dedicated to enhancing people's lives globally through technology, to implement a data-driven solution to monitor the health of the region during the pandemic.
Challenge
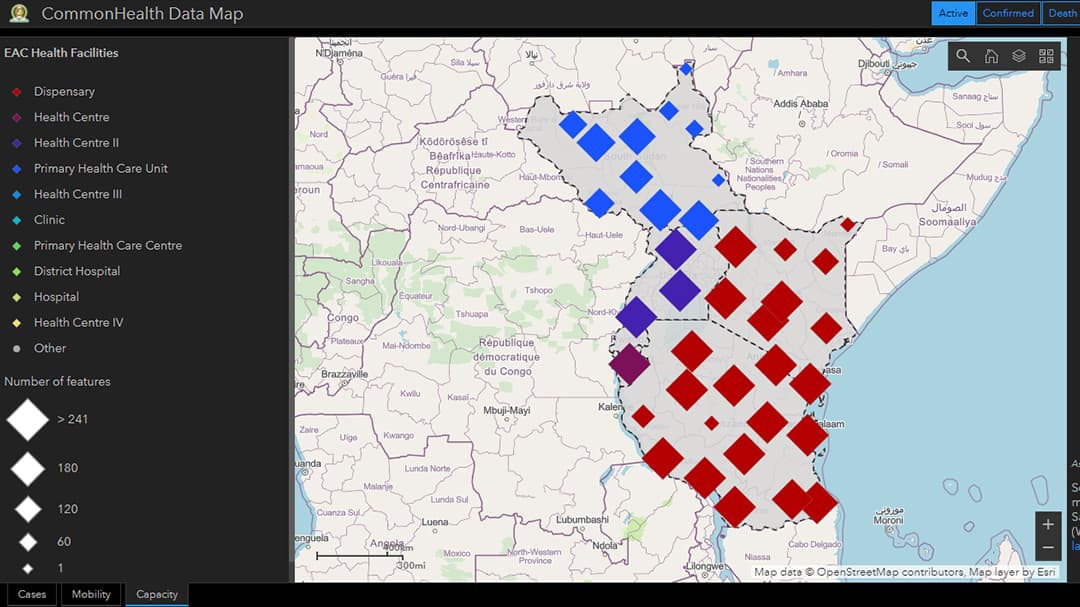
With the need to enhance regional health planning efforts during the pandemic, the EAC sought a visual and data-driven technological solution. The EAC's goal was to capture data regarding the pandemic's impact on mobility, health facility capacity, and other issues. To meet this need, the EAC partnered with TCP to create the CommonHealth Data Map dashboard.
Customer
The East African Community and The Commons Project
Challenge
The Commons Project (TCP), a nonprofit group dedicated to improving people's lives with technology, partnered with the East African Community (EAC) to develop a CommonHealth Data Map dashboard for tracking COVID-19 impact across the region.
Solution
TCP leveraged ArcGIS Online, ArcGIS Experience Builder, and ArcGIS Dashboards technologies to transfer an existing customized COVID-19 dashboard into a long-term, automated, and easy-to-update visual map powered by Esri technology.
Result
TCP successfully transferred the custom dashboard to one based on off-the-shelf Esri technology, empowering the EAC Secretariat with the information necessary to make informed health measures for the region during the pandemic.
Initially, the dashboard was developed as an outsourced, custom-built tool tailored to highlight regional-specific data not included on other widespread COVID-19 dashboards, such as community mobility data.
While the dashboard met the EAC's immediate needs, as requirements stabilized, the need for a custom build dependent on development cycles and coding skills lessened. This allowed TCP to transition the dashboard to one that required less customization and coding and could be automated to pull static datasets and easily updated in-house.
"The goal we had for the EAC was to continue to meet its evolving needs with a dashboard that was visually appealing and informative," says Nigel Edmead, technical lead at The Commons Project. "The challenge was consolidating and presenting data from different, siloed sources in a single dashboard and have data updates run without intervention."
Solution
To meet this challenge, staff at TCP leveraged Esri technology including ArcGIS Online, ArcGIS Experience Builder, and ArcGIS Dashboards. The combination of ArcGIS products allowed the TCP team to address its main concern of managing the various data systems into an all-in-one solution because Esri's technology can help organizations integrate data management, analysis, and collaboration.
For the CommonHealth map, ArcGIS Online provided several benefits. The map contained layers of data from the ArcGIS Living Atlas of the World and the Africa GeoPortal, Johns Hopkins University, World Health Organization (WHO), and Google's Community Mobility Reports. ArcGIS Online also allowed TCP to implement self-service mapping capabilities and, with the use of smart mapping, aid in identifying data patterns that could inform regional health measures. The collaborative abilities of ArcGIS Online also eliminated barriers to data access, allowed for multiple users, and simplified the process for embedding the map on websites and social media platforms.
This work proved critical to understanding how COVID-19 was affecting the region. TCP staff utilized ArcGIS Dashboards to create ready-to-use maps, lists, charts, gauges, and other visual aids for detailing the virus's effect. This met the EAC's need to convey important information at a glance. By migrating the CommonHealth map to Esri technology, TCP also met the EAC's need for an automated and easier to manage dashboard.
"We were committed to replicating the custom dashboard like for like in looks and functionality as much as possible," Edmead continues. "This was an opportunity to meet evolving TCP partner needs and pivot the data in a meaningful way."

Results
TCP successfully transferred the custom dashboard to one based on Esri technology. With this transfer, TCP provided EAC members with a COVID-19 dashboard featuring a high-level view of critical, local pandemic information that is automated and easy to maintain. The dashboard now serves as a vital resource to the EAC Secretariat to better understand trends, monitor status, and communicate with member states. Ultimately, it is a tool to help make informed decisions for public health in the region.
Since the dashboard's launch in September 2020, views from desktop and mobile devices have been averaging 50 per day or roughly over 4,500 views in total. This success inspired members of the Common Market for Eastern and Southern Africa (COMESA) to develop their own dashboard to serve the pan-African economic block.
"The dashboards developed out of an acute need for an East African regional view of COVID-19's impact—from monitoring cases and deaths to tracking the pandemic's effect on population mobility to mapping our health infrastructure in support of response efforts," says Eng. Murenzi Daniel, principal information technology officer at the EAC. "We were excited to partner with [TCP] to develop the Esri COVID-19 dashboard and pleased to have maintained steady visitor numbers since its launch."