A good thing about the System of Engagement is its sustainability over time. It's a different approach to IT—replacing those big, custom one-offs with something much easier to implement and work with.
user story
There has always been an inherent tension in the way software applications have been developed in the public sector. Procurement cycles can often be lengthy affairs, and delivery schedules can extend into years. Risk — the cost in terms of money, reputation and public support if something fails to turn out as hoped — also encourages a play-it-safe attitude to concept and scope.
Compare that to the processes in the flourishing mobile and consumer application industry, where applications for consumer use can take just weeks or a few months to deliver, and far more can be achieved if imaginations are allowed greater freedom and concerns over failure are removed or substantially reduced.
This is precisely what Esri has set out to address with its System of Engagement (SoE).
Through a combination of its own Commercial-Off-The Shelf (COTS) products and close engagement with clients, Esri has created a process which dramatically reduces the time needed for organizations to conceptualize, develop and implement apps which can transform their business practices.
The COTS approach largely does away with custom applications, and in many cases the time taken to actually get an app into the hands of users can be measured in weeks, not months. This is enabling organizations to completely transform how they work, realizing significant savings in time and money. It’s also enabling some to become, within a very short space of time, front-runners within their respective fields.
Just a year on from giving the SoE the green light, the Louisiana Department of Transportation and Development (DOTD) has already fielded over 30 new apps. Already, these are revolutionizing its working routines, saving thousands of man-hours and pushing down cost.
In various ways, DOTD had been searching for a way to tie together its disparate business systems for more than two decades, according to Brad Doucet, Director of Enterprise Support Services.
“The problem was that we’re a large and mature organization that creates and owns a lot of data. To use analytics, and to meet the needs of Federal reporting as well as to support our internal users and partners, we had to have a more efficient system of accessing and exposing the data,” he explains. “We decided to keep our systems of records in place and use the System of Engagement to tap in and develop apps to address specific problems.”
"Our IT department split off and was centralized in the state government's Office of Technology Services [OTS] about five years ago. It came to a point where we had three major parties that had to be in lockstep with each other for this all to happen. That collaboration, especially in year one, between Esri, DOTD, and OTS has been our greatest success."
"There are a lot of moving parts," he continues. "Our IT department split off and was centralized in the state government's Office of Technology Services [OTS] about five years ago. It came to a point where we had three major parties that had to be in lockstep with each other for this all to happen. That collaboration, especially in year one, between Esri, DOTD, and OTS [has] been our greatest success."
Though DOTD decision-makers looked at several other solutions, Doucet notes alternatives were "essentially data warehouses or lakes, which put all the data in one place but then leave you searching for a way to tie information together."
One common trait for all data is that it has a location—a fact that inspired Doucet and others at the DOTD to want to present the department's information in a geospatial format. According to Doucet, this made Esri's GIS-based SoE the natural choice.
The SoE starts with a series of business and discovery workshops, with Esri experts on-site to support the work. Together, Esri and organization staff scope out what the team is looking to achieve and what technology and data will be needed.
By the end of that process, DOTD leaders had identified 61 apps that would help drive performance and create greater efficiencies. Prioritization reduced that to an initial 15, recognizing that in Year One creating the technical foundation for future work would also be happening. Doucet describes the first year as “building the aircraft while flying it”.
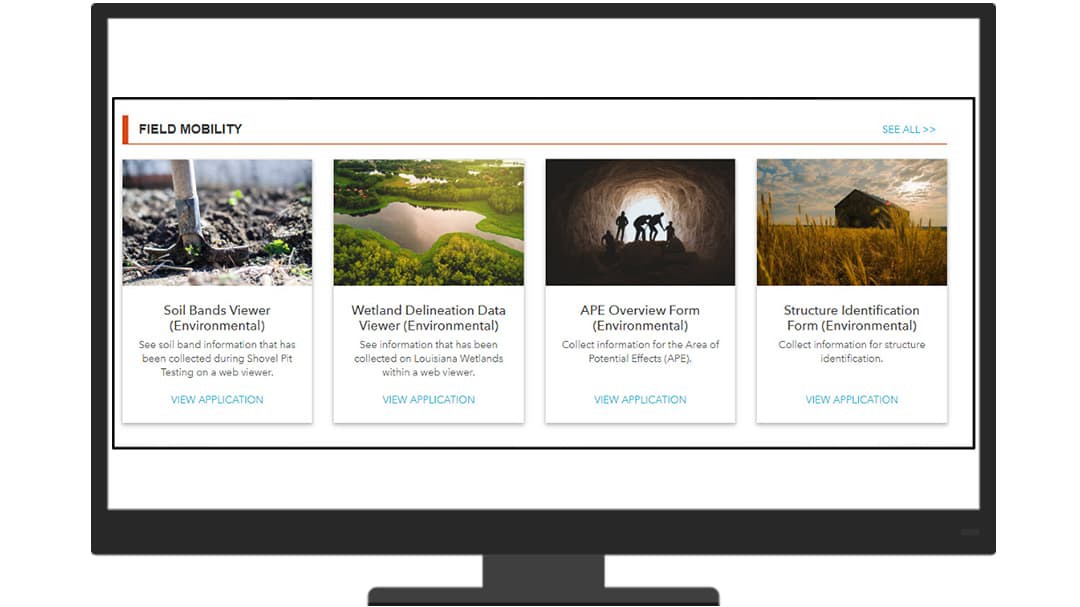
"Once we started to look at those 15 apps and the technical work needed, the number turned into a little over 30," he said. "This was based on the technical tools available to us and the most efficient way to do things. It's an interactive effort—we're using Agile project management techniques. If we fail, we'll do so quickly and small. We don't have to wait a year to see that something doesn't work. It's that iterative process that enables all this to happen."
Agile project management techniques were a revelation for some within DOTD, according to Doucet.
"Typically, in IT, you put all of your systems requirements together and talk to your business leaders up front," he said. "Your technical people then go off and build something for you and maybe come back three to six months later. In today's climate, business needs could have changed in that amount of time, and any miscommunication up front can cause real issues."
Instead of the department's teams working disparately, they kept collaboration strong by having weekly progress meetings.
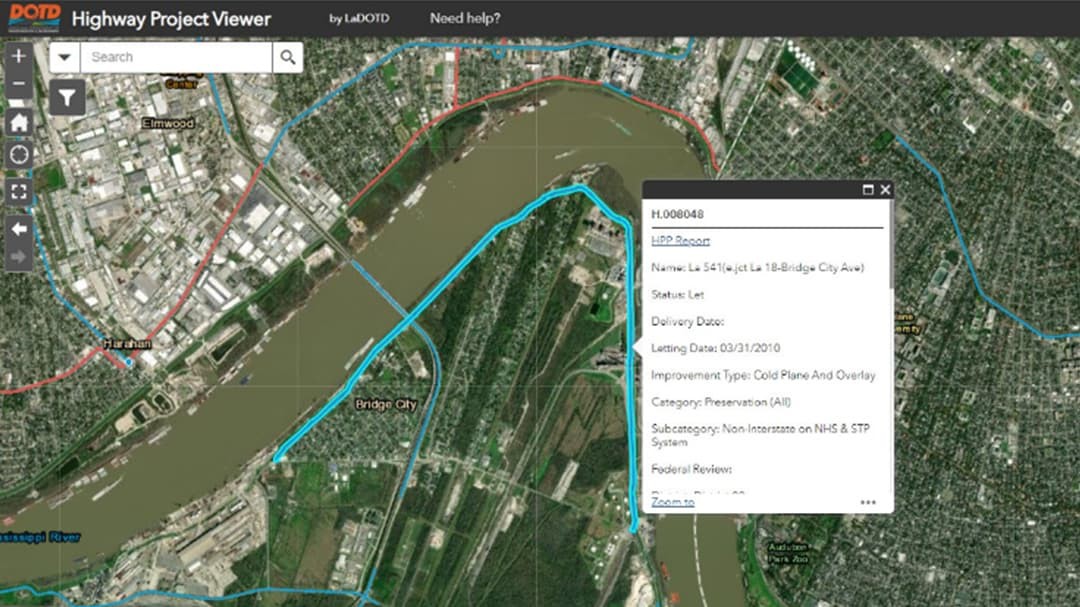
One of DOTD’s most widely used apps, the Highway Projects Viewer, which gives information on construction projects, illustrates how the SoE works. Using a suite of COTS tools, Esri was able to bring together information from multiple data sources and package it in one place.
“It’s not a custom development — that’s something we really wanted to stay away from — but it’s easily developable for us without us needing to have a specialist on board at all times,” says Doucet. “Just about every DOTD employee can access it. They can go to one place and get to the information they need, rather than three or four as before — if indeed they even had access to all of those other systems.”
Universal access and its speed are key differentiators. For example, DOTD has also created a 511 Road Closures app which is far more user-friendly than the state’s already existing 511 app. Internal and external users can very easily pick points in time and locations and see closures.
Field workers have also benefited considerably. For example, the Soil Band App has replaced environmental engineers’ hand-written notes.
“Previously, that information in notebooks was taken back to an office and we used a desktop graphics editor to create an image of what we had,” Doucet explains. “Now, we have forms on a tablet or phone and the relevant graphs are automatically generated.
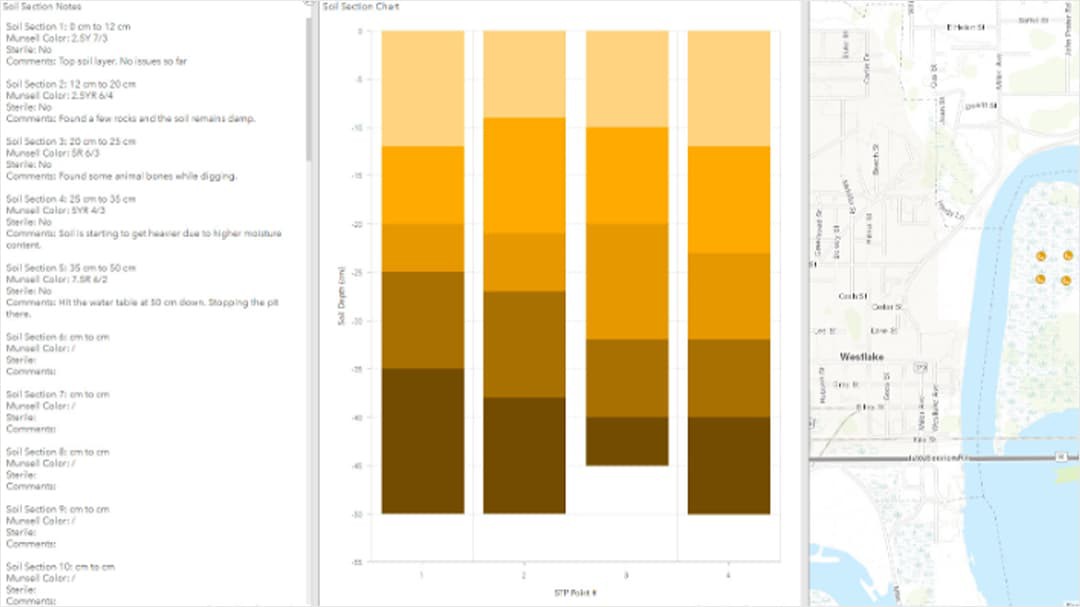
“It’s been estimated that the suite of field apps that we’ve developed for our environmental engineers saves 300 man-hours per project. That was a small, readily configurable suite of apps that we were able to create through the System of Engagement that has resulted in a tremendous positive impact to DOTD.”
Exposing data to more scrutiny and comment creates a virtuous cycle of quality improvement.
Doucet: “That’s been one of the chief benefits. Before, because everything was siloed, only a limited amount of folks could see the data and whether it was right or not. Now, because more folks can see it, it can be challenged, and any incorrect data can be remedied.
“We’ve had overwhelmingly good feedback from the people who use these apps. A challenge in Year One, given our finite resources, has been keeping up with those who want to be a part of this. Even where apps have already been developed, people are wanting to add to them because they can really see how they can make their jobs easier. Creativity has increased across the board.”
“That’s going to allow us to get more governance. For instance, in the Highways Project Viewer, construction is the last phase. There are five other phases that we have data for that’s not on the Viewer at present. Some other ideas for apps may not fit into existing apps. We may even reach a point of retiring some apps, although I don’t see that happening at this stage.”
“It’s clear though that the tools that we’ve been able to create allow us to do things that are of real value. One example: we’re a very flat state with a long coastline and an app we’re looking to develop in Year 2 is for flood inundation.” This a predictive tool, based on elevation — “If a surge comes up from a hurricane and we have ‘X’ many inches of rain, which roads can we expect to flood?” “We have Lidar data and we’re collecting enhanced data to work out where those roads would be and then work through our Emergency Management Center to manage that.”
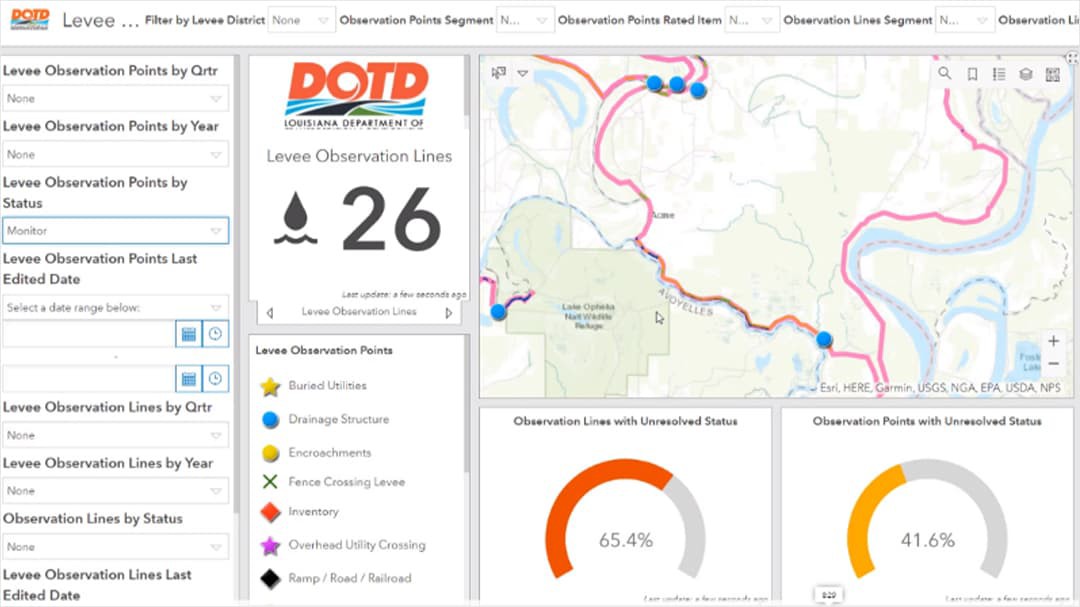
With the technical foundations in place, year two and onward will see accelerated expansion and improvement of the DOTD's app set.
“In Year Two I think we’re really going to take off. How all this is constructed and configured through COTS products encourages internal collaboration as compared to simply getting a contractor in to build a system that then has to be maintained somehow.
“A good thing about the System of Engagement is its sustainability over time. It’s a different approach to IT — replacing those big, custom one-offs with something much easier to implement and work with.”

A good thing about the System of Engagement is its sustainability over time. It's a different approach to IT—replacing those big, custom one-offs with something much easier to implement and work with.