The City of Melrose, Massachusetts, is a quaint suburb located seven miles north of Boston. With stunning nature preserves, historic architecture, and charming neighborhoods, Melrose offers its more than 28,000 residents an idyllic setting to live and work.
The rapid spread of coronavirus disease 2019 (COVID-19) has impacted towns big and small across the United States, and Melrose city officials had to quickly prepare for the emerging crisis. The ability to communicate timely information effectively is an important tool in the fight against COVID-19, and the City of Melrose wanted to provide residents with up-to-date information on the pandemic to protect residents and keep them healthy and safe.
Local officials set out to create an informational website to help the public. The geographic information system (GIS) team implemented a new solution: community engagement software that allowed officials to effectively share vital resources, including statistics and prevention tips, with Melrose residents. With a small team and limited resources, the City of Melrose created a new site that has become a trusted source of information for the town.
The primary goal of this project was to build an informational web page for Mayor Paul Brodeur to communicate with all Melrose residents during the COVID-19 pandemic. According to Christopher Wilcock, MAA, chief assessor and director of GIS for the City of Melrose, the idea was to combine statistics, updated videos, educational information, and self-help tools for residents to navigate the pandemic.
Wilcock says the city's current website software had limitations on design and functions. As such, the city GIS team was in search of a new solution that was easy to configure and could add dynamic features such as interactive maps.
"At the beginning of the pandemic, there was a need to help the city get information out in a more visual, user-friendly, and dynamic way," says Jane Pitts, GIS analyst for the City of Melrose. "Our city's current website is full of text and hard to navigate for the user."
Wilcock says the GIS team was brought in to work on the back end and determine how to get organized, and communicating information was key. The goal was to stay current, stay fluid, and continue to add new content as it was made available. The team began the project by discussing all the available data and COVID-19 content that could be used.
"Our job with the site was to have people informed with the numbers, [tell them] where they could get help if they needed, and also to comfort them a little with a message from the mayor that's relevant every day," says Wilcock.
The GIS team selected ArcGIS Hub to create its informational web page. ArcGIS Hub is a cloud-based engagement platform that allows organizations to work more effectively with their communities. Pitts, an Esri user since 2001, chose Hub because it would allow the team to create a dynamic site and cater the solution to the needs of the community.
Wilcock says, "We evaluated every piece of software that the city had in place; and in our opinion, ArcGIS Hub was the only product that could get it done quickly and efficiently."
According to Pitts, she received an invitation from her local Esri office to attend an ArcGIS Hub webinar, which taught her how to use the new Coronavirus Response template. The template enables organizations to add their own branding, resources, and data regarding the COVID-19 outbreak to a web page.
"It was a great product to work with. In hindsight, the timing [of the webinar] was perfect," says Pitts. "I thought Hub was the best solution for informing the public."
The webinar also directed her to view a gallery of other community hub sites from the US and Canada for inspiration. Wilcock and Pitts spent a lot of time viewing other state, county, and local government hub sites and reassembled the ideas they saw into a format that suited their city.
"I think that's a great thing for collaboration in small cities to get things done fast and efficiently. We don't necessarily have a lot of time, so if we can find something that's working in another community and modify it, that's a lot easier than starting from scratch," says Wilcock.
Pitts adds, "GIS users are always helpful and sharing what they've done. Nathaniel Bowen of Marlborough, Massachusetts, posted his hub page and encouraged other city and county GIS departments in the state [to create their own site]. I reached out to him, and he was very helpful in the process of getting the Melrose site started."
The implementation of Hub and the new template was simple. Wilcock says most of the training was done by self-paced learning, reviewing other Hub templates, and evaluating other COVID-19 sites.
"For me, the learning curve was not too hard. The webinar, which I then followed up with a few more YouTube videos, made the basic structure for creating and editing easy to learn," says Pitts.
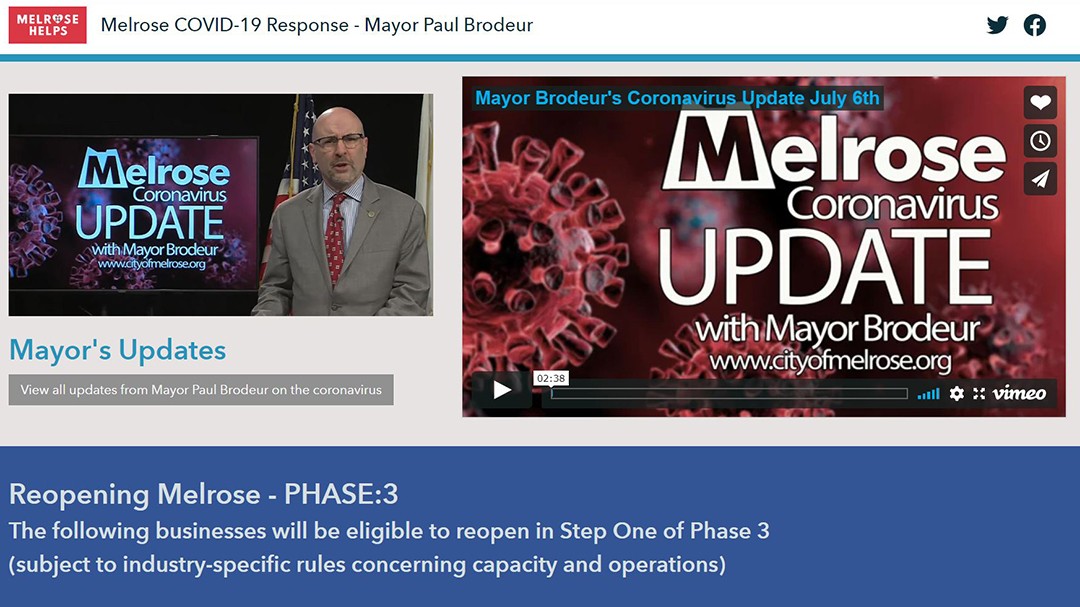
The completed hub site includes interactive maps and dashboards as well as daily video updates from Mayor Paul Brodeur. There is also a page dedicated to COVID-19-related statistics and vital resources such as a symptom checker. A section has also been added that details the four-phase plan for reopening the state.
 The City of Melrose COVID-19 Information Hub includes up-to-date information on COVID-19 cases, testing, vaccinations, and travel orders along with video messages from the mayor.
With more than 6,100 hits on the website, ArcGIS Hub and the Coronavirus Response template has helped the GIS team efficiently communicate with and reach residents. The new site is updated daily, as it was very important to the GIS team not to have a page with stale data.
"My goals for this project were to reach everyone. Everyone has different questions and needs in relation to how COVID-19 was affecting their lives," says Pitts. "I tried to give [our residents] quick, simple information up front with visuals, explanations, and facts, along with links to the Centers for Disease Control and Prevention (CDC) and state health information."
Wilcock adds, "From the start of the project, the information hub web page was professional, informative, current, and worked across all computer operating systems."
The feedback from the community has been very positive. Wilcock says it's been very well received in the community, and residents love not only the site details but the responsiveness of it. "They like all the graphs [and visuals]. It's today's kind of technology with a message, which I think is very unique," says Wilcock.
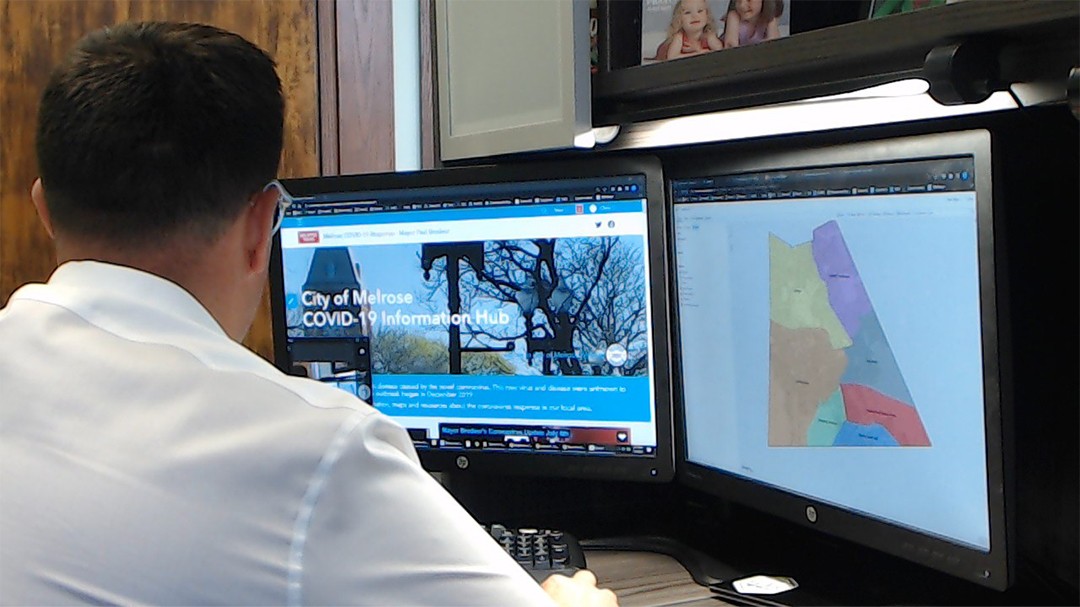
 City of Melrose community members and residents can easily find and view interactive maps and dashboards on the City of Melrose COVID-19 Information Hub.
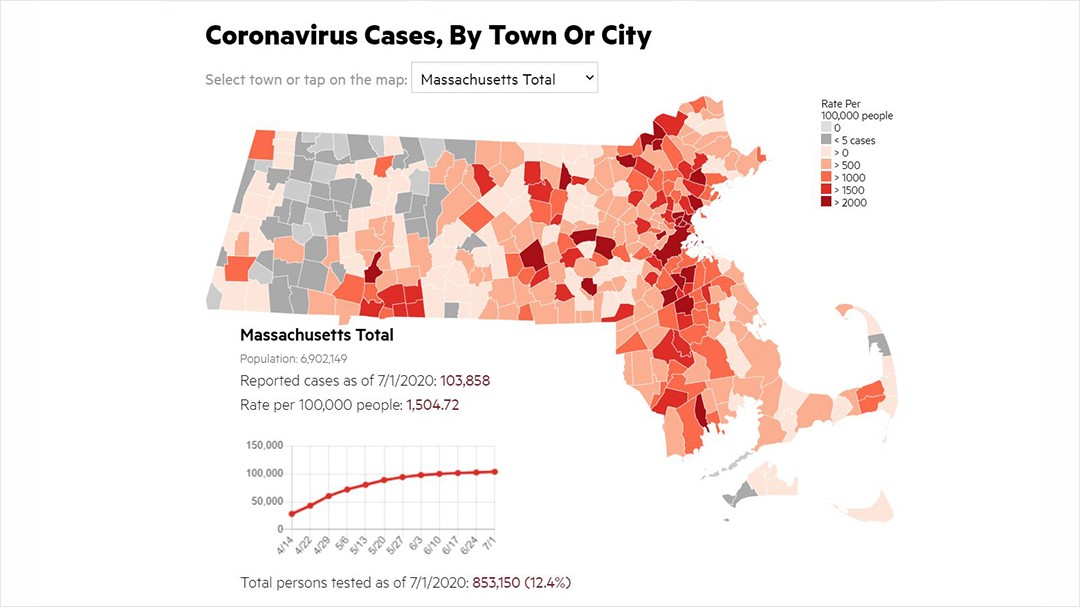
 Maps and graphs displayed on the City of Melrose COVID-19 Information Hub, like this Coronavirus Cases, By Town Or City example, provide residents with easy to understand visuals showing coronavirus case counts and other important stats and information by geographic region.
Overall, the City of Melrose GIS team hopes to inspire other smaller GIS departments with its hub site. Both Pitts and Wilcock say they are "thrilled" with the ArcGIS Hub platform and believe others can use it to complete difficult projects.
"We did not have the resources [of a big city]. So it was a lot of long nights. It was a lot of brainstorming on whiteboards and rethinking technology and problem solving," says Wilcock. "There's a lot of communities that don't even have a GIS department. They don't have a lot of resources. This is something that they can do."
Pitts and Wilcock encourage GIS teams to look at other sites and search through online resources to pick and choose different elements, site designs, and layouts they want to emulate. "It's just a true testament on how easy it is to navigate this [template], and also how you can start with a template and get something together and make it your own," says Wilcock.
Wilcock adds, "As a manager, I believe that software should empower users to solve problems. The ArcGIS Hub software empowered Jane to create an interactive web page to address a national health emergency that involved every resident in the City of Melrose."


 City of Melrose community members and residents can easily find and view interactive maps and dashboards on the City of Melrose COVID-19 Information Hub.
