ArcGIS Tutorial
Learn about your community using ACS layers
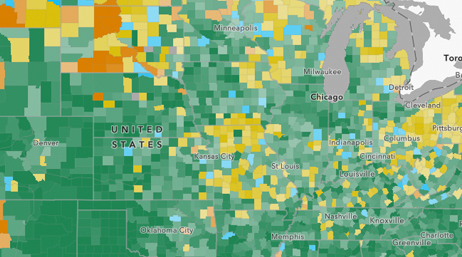
Map demographic information with US Census Bureau American Community Survey (ACS) content from ArcGIS Living Atlas of the World.
GIS tools to assess equity
Governments are seeking to eliminate inequities on the basis of race, gender, socioeconomic status, sexual orientation, disability status, and more. Discover how GIS solutions foster greater understanding and empower equitable action.
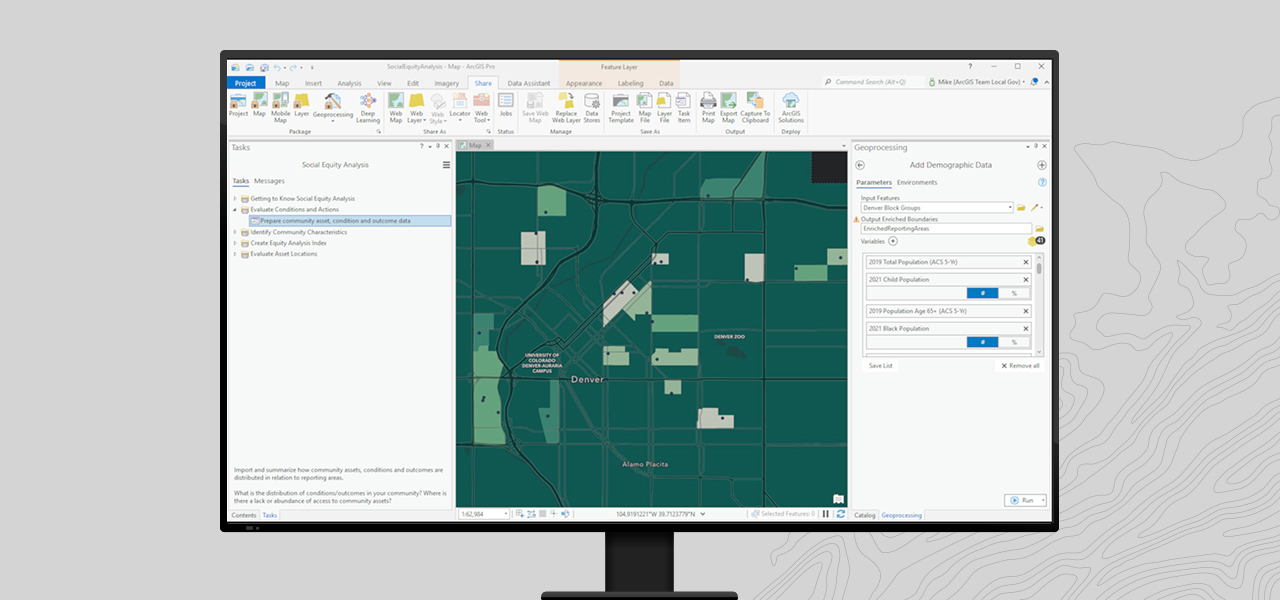
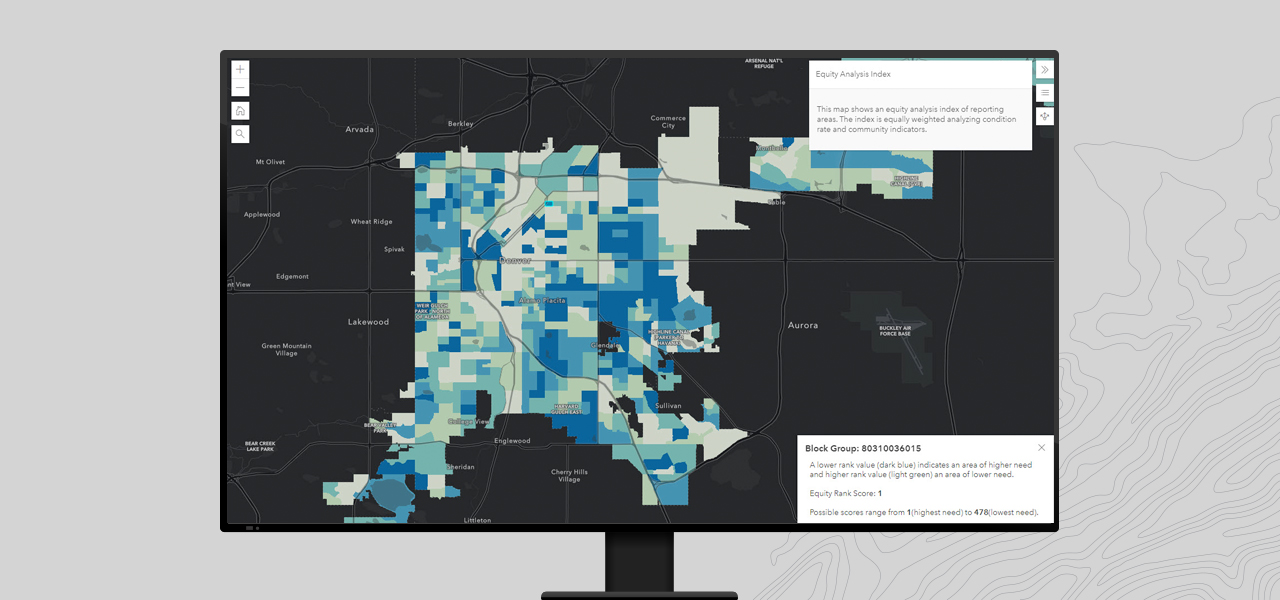
Equity leaders want to understand where community condition rates like health outcomes and internet access may be high or low so programs and investments can be adjusted when and where appropriate. GIS helps equity analysts load asset, condition, or outcome data; aggregate it into geographic reporting areas; calculate a community condition rate, and create an equity index for a given geography.
Governments need to know where population groups are located across their jurisdictions to understand whether access to community resources is equitable. Ready-to-use demographic information and spatial analysis tools help analysts perform racial and social equity impact assessments to evaluate where resources are abundant or lacking for specific racial and ethnic groups.
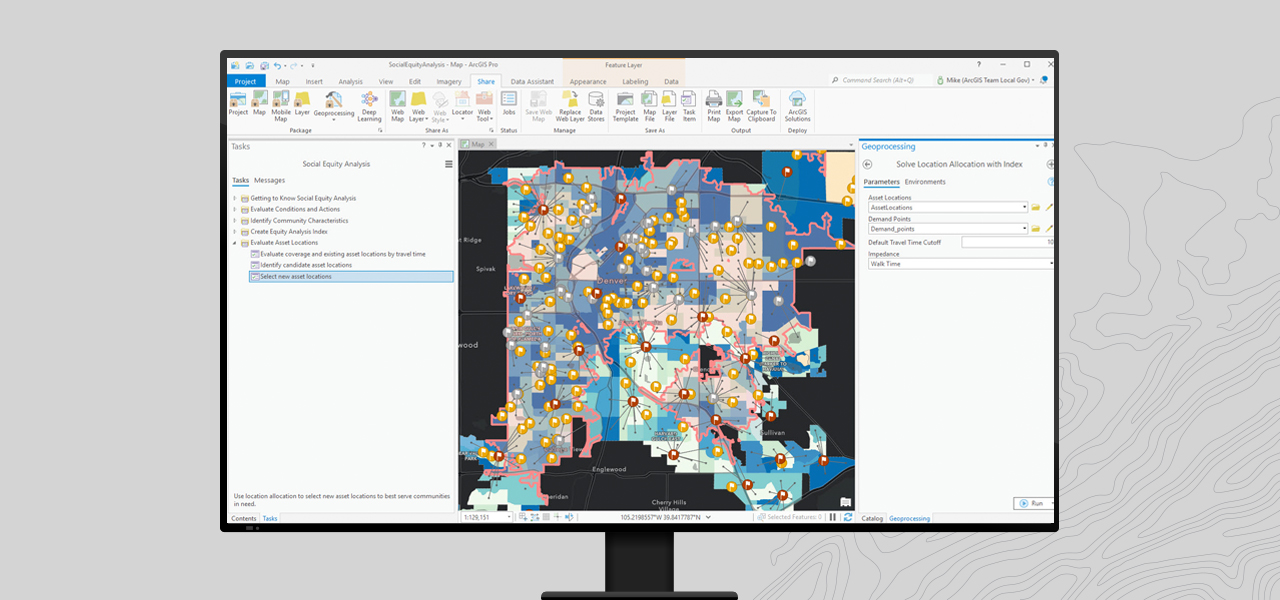
Governments need data-driven methods to evaluate candidate sites for new resource investments intended to address inequities. GIS-based social equity analysis tools can help organizations conduct equity impact assessments of proposed interventions to ensure limited resources have the greatest impact.
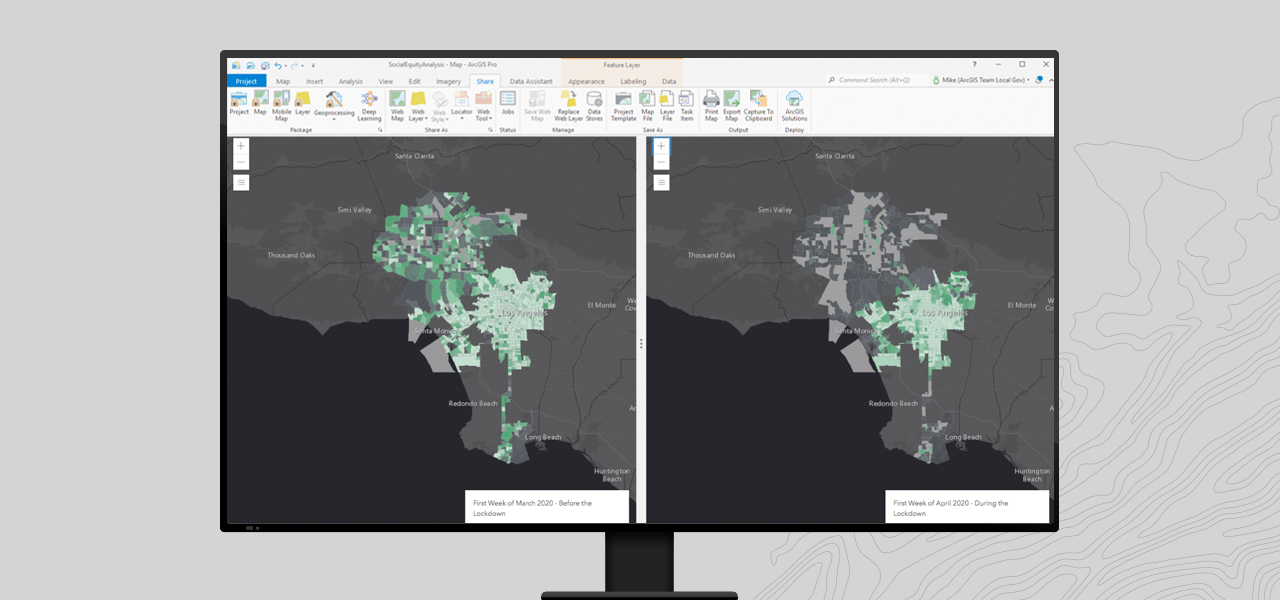
It is crucial for leaders of equity initiatives to set goals and measure progress over time. GIS solutions help leaders routinely conduct equity impact analyses that monitor changing community assets and conditions to evaluate whether their actions are contributing to more equitable outcomes and communities.
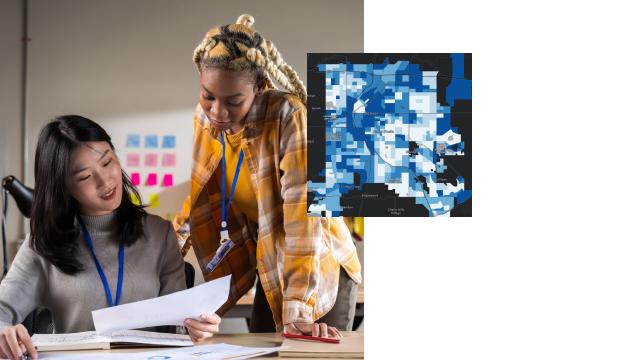
Community engagement, outreach, and collaboration are crucial to informed decision-making for equitable outcomes. GIS solutions allow users to share analysis results in engaging maps and interactive visualizations, making it easier for stakeholders to understand where equitable or inequitable conditions exist to propose action.

Esri's Social Equity Analysis solution helps governments assess where lack of access to resources exists, who is impacted, and where to intervene.

Learn about your community using ACS layers

Build an app to expand food access

Measure and visualize digital exclusion
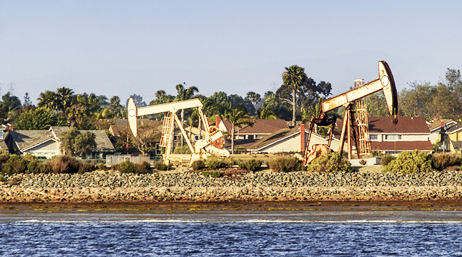
Calculate environmental equity for public policy

Policy mapping—improve newborn health
Fill out this form, and we will contact you to help your government organization address racial inequity with GIS.