Skip to Content

Data-Driven Analysis

Unlock the power of urban analytics for 3D scenario modeling

A pie and bar chart with text and numerical data summarizing key data next to an image of 3D yellow and green buildings

Measure impact as you plan

Make urban analysis part of the 3D modeling process by establishing baselines for key performance indicators like number of households, trip generation, and energy consumption. 

What you can do with ArcGIS Urban

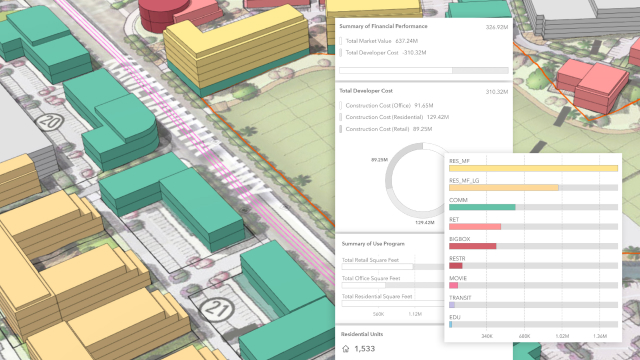
Calculate proposal impact in real time

Simplify early-stage planning with real-time urban analytics and visualizations. Compare and iterate conceptual designs with on key capacity metrics. Evaluate simple growth metrics like population or number of jobs, or complex ones like expenditure and revenue of developments in dynamic dashboards. 

A GIF with blue and yellow 3D buildings, text, and numbers showing key metrics related to space uses in a 3D building

Identify areas of potential

Perform site suitability analysis by layering multiple datasets, and then adjust weights to criteria like zoning types, maximum building height, and existing building age. Changes to weights will automatically reflect in the scoring, saving you time and resources when identifying suitable locations for development. 

: A GIF with a square and areas highlighted in green with text to the right showing areas suitable for development

Leverage your GIS data

Access essential planning data layers, such as zoning and parcel boundaries, along with contextual data directly from your organization's GIS repository and maintain a seamless dataflow with support for coordinate systems. Data you create in ArcGIS Urban, such as suitability analysis, project reviews, and rezoning, can be easily integrated back into your GIS, ensuring up-to-date urban analytics for future decision-making. 

A GIF of several blue and green shapes showing a pop-up window with building properties related to a 3D building

USE CASE

Impact analysis

Ensure that your next comprehensive plan update considers the effects of different planning strategies on the community with scenarios designed to evaluate key metrics for specific parcels, districts, and neighborhoods. See how aspern Seestadt’s 3D geospatial digital twin lets planners and architects measure progress against the original development plan and examine future scenarios.  

Read the blog
A 3D depiction of a neighborhood with green trees, orange and gray buildings, and blue water along with development metrics

Who can benefit from ArcGIS Urban

Previous
Next

Contact sales

Please share your information and our sales team will contact you soon. We look forward to communicating with you.