
Three Possible Scenarios Surface
The May 1998 Riot in Jakarta, Indonesia, Analyzed with GIS
By Prof. Dadan Umar Daihani, DEA, Director of Trisakti Research Institute, and Agus Budi Purnomo, Ph.D., Ms.C., Head of Trisakti Urban Research CenterIn May 1998 there was a riot in Jakarta, Indonesia, in which about 1,500 people died and 4,000 buildings were damaged, burned, or totally destroyed. The riot began in the 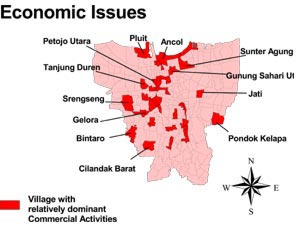 morning of May 13 and was finally quelled by the military on May 15. The riot spread all through Jakarta where the most severe damage was in the west, central, east, and north districts.
Right: The damage to buildings during the May 1998 riot was concentrated in villages with dominant commercial activity.
What was the cause of this riot?
Historical Context
Indonesia is a country with multivarious races, cultures, religions, and languages. In the last millennium, the peoples of the archipelago were brought into a union three times. In the twelfth century the archipelago was united under the Sriwijaya Kingdom, then under the Majapahit in the fourteenth century, and finally in the twentieth century under the Republic of Indonesia. Even before the Dutch colonial era, the petty kingdoms were hostile to each other. It is not surprising, therefore, to see a history of upheaval, riot, and violence that marks Indonesia's dynamic of multicultural interaction.
In the modern era, despite Indonesia being long touted for its sound macroeconomic management and spectacular growth, the Asian financial crisis in 1997/1998 revealed the weak underpinnings of its economy. By the end of 1997, the monetary crisis in Indonesia was in full swing. Large-scale forced unemployment had left many people uprooted from their sources of livelihood. In the same year, the crisis had caused the liquidation of 16 large private banks. As a result many peoples' savings were lost. The forced unemployment and financial bankruptcy had drastically decreased the living conditions in Indonesia. In addition, there were untenable levels of private foreign debt and noncompetitive practices that favored the financial interests of President Suharto's family and friends. This economic hardship and popular resentment of the government inevitably brought Indonesia into turmoil. The country saw student demonstrations and public unrest as well as the widespread rioting under discussion.
At the time, government authorities agreed that the May riot was a serious tragedy for the nation but stopped short at explaining why the riot had happened.
Shedding Light with GIS
In an effort to understand the causes of such a national tragedy, a week afterward a team of surveyors from the University of Trisakti Research Institute was dispatched around Jakarta. Their main task was to note all of the consequences of the riot. 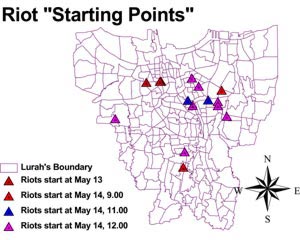 However, the team could only take note of the condition of the damaged buildings. The political climate at that time was too volatile for asking questions. The notes taken by the surveyors included the functions, types, locations, and addresses of the buildings. The relative locations of the buildings to main streets and housing complexes were also noted to indicate the context. The surveyors also noted the physical description such as the area, length, width, and numbers of stories of each building.
Above left: From the spatiotemporal aspect, a pattern emerges that shows the initial points of violence distributed in a wide area with similar start times.
The information was then organized and mapped as points into an ArcView GIS map. To see the connection of the riot to ethnic, economic, and political aspects, the point map was then superimposed with polygon data from the Indonesian Bureau of Statistics (BPS) that included such data as the distribution of Islamic and Buddhist populations and the commercial activities in villages. Since the BPS had no data directly concerned with ethnicity, it was decided that the religious data could be used as a proxy for ethnicity. Fortunately, in Indonesia there is a correlation between ethnicity and religion.
In addition, since the unit areas between the riot data and demographic data were different, it was decided to aggregate the building data into a spatial unit that was used by the BPS. That spatial unit is the "village unit"--with an average area of 1.52 square kilometers.
By using spatial correlation and segregation indexes, the data was mapped and correlated, revealing several interesting results that show a pattern of the riots. The indexes were calculated by using a simple Avenue script.
From the data, the following observations can be introduced:
- The highest concentration of damaged buildings overlaps with villages that have a dominant Buddhist (i.e., ethnic Chinese) population.
- The damage to buildings was also concentrated in villages with dominant commercial activity.
- From the spatiotemporal aspect of the riots, a certain pattern emerges that shows the initial points of violence distributed in a wide area (average interpoint distances of 6.5 km). The start times of the riots at those initial points are relatively similar. Therefore, it can be concluded that the riots began in distributed points around Jakarta simultaneously.
From these results, it is suggested that there is a connection between the riot and ethnicity, especially toward ethnic Chinese and economic issues. There appeared to be a greater degree of destruction in those commercial areas with Businesses operated by ethnic Chinese residents. The implication of this is that the riot was ethnically motivated due to negative sentiment of the indigenous people to the relatively more prosperous ethnic Chinese.
In addition, the spatially dispersed distribution but spontaneous initial occurrences of the riot indicates an unnatural event. This implies that the riot might have been caused and designed intentionally. Typically, the spread of a spontaneous riot is like the ripples in a pond spreading out from the point of disturbance. In the May 1998 riot, however, there were several disturbances at the same time in several areas, from which a degree of intention is extrapolated.
Conclusion
After two years there is not yet a satisfactory explanation of the riot forthcoming from the government. Nevertheless, with ArcView GIS, it was possible to map the buildings that were damaged in the May 1998 Jakarta riot. Furthermore, by developing a simple Avenue script, it became possible to see patterns that suggested a cause. However, due to the complex historical context of the region, it would be a mistake to isolate only one cause. The three scenarios that were developed link the riot to racial, economical, and political issues that existed in Indonesia at that time.
For more information, contact Dadan Umar Daihani, director, Lembaga Penelitian Universitas Trisakti, Ged M Lt XI, Jln Kyai Tapa No. 1 (Grogol), Jakarta 11440, Indonesia (tel.: 62-21-5684021, fax: 62-21-5684021, e-mail: dadan@trisakti.ac.id).