
Modeling Tools for Santa Barbara Smart Growth Planning Supported with GIS
The Geography Department at the University of California, Santa Barbara (UCSB), is working closely with a local nonprofit organization to help develop an ArcView GIS software-based GIS and a set of modeling tools that can be used to promote regional thinking and smart growth concepts to the local community. Like many sprawling communities, Santa Barbara is divided into a host of different local jurisdictions and includes one new incorporation effort for a "city" of Goleta. However, each jurisdiction shares their geographic location on a narrow coastal plain squeezed between the Santa Ynez Mountains and the Pacific Ocean. The area has grown rapidly since World War II, reaching a 2000 Census population of 399,347 for the County, with 200,363 of these people located on the South Coast. As the area approaches maximum build-out, issues such as housing affordability, transportation, and governance are at the forefront of local politics. These problems give the appearance of being community-specific, yet their solutions lie at the regional scale and through GIS and computer modeling.

This image shows output from ArcView of one of the simulation scenarios generated using SLEUTH. Yellow zones were urban in 2000. Light to dark pink show increasing probability of urbanization by 2040. Cmmunity general plan regions are shown in green. In this scenario, all land protection was removed, and only existing parks were protected from urban growth.
Background
In the spring of 1998 the executive director of the Santa Barbara Region Economic Community Project (ECP) approached the UCSB Geography Department in search of better ways to holistically visualize the urban area of the South Coast of Santa Barbara County.
"The ECP's original mission was to attract high-tech companies to the Santa Barbara area," said Jim Neumann, former ECP executive director, "but as the boom of the nineties solved this problem we refocused our efforts toward promoting regionalism and better land use practices in the area."
The communities of the South Coast had numerous zoning and general plan maps but no single map that covered all of the region. In addition, there were different independent GIS data sets available for each community, some Esri and ArcInfo software-based, others little more than CAD versions of drawings. They had also heard about Dr. Keith Clarke's urban growth model, which had been developed for the USGS (www.ncgia.ucsb.edu/projects/gig) and applied to various large urban areas across the United States. They wondered if it might be possible to apply it to the local area of the South Coast. Clarke agreed to work with the group, bringing work started for national level work to the local area.
What started as one modeling effort quickly grew to include three integrated "Smart Growth Tools"--the ArcView GIS software-based GIS with its dozens of shapefile layers and its ability to display and analyze the predictions and two computer models that used the GIS data for input.
Regional GIS
In preparation for calibrating the urban growth model for Santa Barbara, many new data sets needed to be collected. This process rapidly demonstrated the need for a regional GIS (REGIS) for the area beyond the assessors' parcel map database that the County had created for its REGIS program using workstation-based ArcInfo 7. The original data needed for the model was historic urban growth, major road networks, and slope of the terrain and areas excluded from development for various reasons such as parks. To gather historical urban extents, aerial photography was used. Having a local aerospace industry that dates back to the early 1900s and an exceptional map and imagery laboratory right on the UCSB campus, finding good aerial photographs was not a problem. Individual frames were scanned into the computer, and georeferenced mosaics of the area were created dating back to 1929 using ArcInfo 8 software's rectification procedures. Seven individual mosaics were created at approximately 10-year increments up to 1997 that served as the early foundation of the regional GIS.
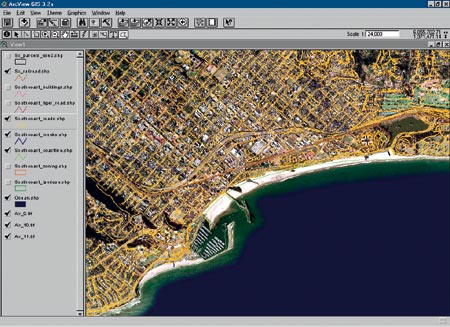 ArcView display of some of the data layers in the Santa Barbara regional GIS centered on Stearns Wharf, showing double line vector roads, creeks, and the air photo image base for the GIS. |
The assessors' digital parcel map was most useful in creating a very detailed land use map. When the parcels were color-coded using the land use attribute, it created a detailed land use map down to the parcel level. The Santa Barbara County Assessor's Office is responsible for coordinating GIS efforts on a County-wide basis. Its continuously updated parcel map in ArcInfo serves as the foundation of the various jurisdictions' GIS efforts.
Many students in the Geography Department at the Bren School of Environmental Science and Management and the program in Environmental Studies, as well as in undergraduate classes, have been able to conduct their research on the local area by having access to the GIS data in ArcView GIS 3.2 and ArcInfo 8.
SLEUTH--Urban Growth Modeling
The SLEUTH urban growth model has been applied to many major metropolitan cities across the United States but had never been applied with such fine spatial detail as in Santa Barbara.
"The SLEUTH model was originally designed to look at the impact of urbanization on global change," said Clarke. "By using the model in the Santa Barbara area, we are thinking globally and acting locally. This is a great way to get the university-led theoretical geographic research into the nitty-gritty of real work planning and application. I want to use what I know best for the benefits of my local community and to improve the quality of life."
Access to high-quality input data allowed the modeling effort to take place at a ground resolution of 30 meters, as opposed to 100 meters and higher as it had in the past. The physical characteristics of the area also differed from other cities modeled. With the ocean bordering one side of the urban area and a steep mountain range bordering the other, Santa Barbara's natural boundaries to growth are obvious.
ArcView GIS played a critical role in assembling, georectifying, and editing the model's input layers. ArcView GIS also receives the model's output in the form of predictions so that further display and analysis can take place including Web-based visualizations. This model-GIS relationship is commonly called loose coupling. The modeling clearly indicated that Santa Barbara is already very close to full build-out. Four future scenarios were modeled, ranging from enforcing an urban growth boundary to allowing unrestricted development to take place. When viewed by the public, the scenarios help generate a discussion of the problems of growth and the policies that can be created to guide it.
SeeTheFuture
The SeeTheFuture model, a sort of "Sim City, Santa Barbara Style," is a systems dynamics model that allows the user to investigate the implications of following different urban growth policies. The policy decisions can be examined by displaying the effects they have on a multitude of indicators such as population, the housing market, land use, quality of life indicators, and employment.
Presently the model is set up in the modeling language STELLA as a series of graphs that show what happens to individual indicators as policies are adjusted. These will eventually be coupled with the growth model so that viewers could eventually see the results in a geographic context using the GIS as a conduit.
Power to the People (Community Involvement)
Work on the tools has taken almost two years to complete. Now that the tools exist, the goal of the ECP is to be able to use them in public outreach to planners, community groups, and citizens. The next step is to use the tools together with the GIS to involve those who usually do not take part in addressing planning issues in the area. Through viewing the GIS, using both ArcView GIS 3.2 and ArcIMS via the Web, and the predictions from the various models, the general public can better visualize the regional consequences of the important decisions that are being made in their local area.
For more information, contact Keith C. Clarke, professor and chair of the Department of Geography at the University of California, Santa Barbara, or Ryan Aubry, graduate student in geography at UCSB (tel.: 805-893-7961, e-mail: kclarke@geog.ucsb.edu). Visit www.ncgia.ucsb.edu/projects/gig to see Keith Clarke's urban growth model developed for the USGS.