


|
|
||
|
|
|
|
|
|
Geographic Imagery Helps Queensland, Australia, Map Land Clearing
The NGGI cited forest and vegetation clearing as factors responsible for nearly a quarter of gas emissions in Australia. Queensland, a large state at 1.7 million square kilometers, was named a major contributor to emissions due to the fact that 75 percent of land clearing in the country is conducted within its borders. Additionally, Queensland found itself in an age-old battle: development versus conservation. Environmentalists wanted strict controls on destruction of vegetated lands, while farmers and graziers (Australia's ranchers)--those most often involved in legal clearing--pointed to their responsibility to feed a growing population and develop land for greater production. The debate lacked hard facts on the exact level of clearing. Environmentalists estimated that up to one million hectares of wooded land were lost each year in Queensland, but graziers put the figure at a much lower rate. An earlier report by the federal government listed the annual clearing rate at about 500,000 hectares. As a result, the Queensland Department of Natural Resources (DNR) initiated the ongoing Statewide Landcover and Trees Study (SLATS) in July 1996. SLATS is the largest satellite image processing and GIS project ever attempted in Australia, in terms of geographic size and data volume. The project is considered a major success. Actual land clearing rates for 1991 to 1995 measured at about 289,000 hectares per year, while rates for 1995 to 1997 measured 340,000 hectares per year--considerably below earlier estimates. Initial tree clearing guidelines were adopted in 1997 and the ongoing results will be central to drafting additional regulations for the State. "The political value of this [image processing and GIS] information is that the final policy will be derived from scientific data instead of speculation," said Tim Danaher, SLATS program manager. Gearing Up for SLATSClear-cutting for agriculture and livestock grazing is considered a major factor in global warming. Many scientists agree that global clearing is throwing the earth's carbon dioxide cycle out of balance, creating the greenhouse effect. According to DNR figures, more than 80 percent of Queensland's diverse and expansive forests hold the potential for agricultural or urban development. As the agency responsible for maintaining this vast resource, DNR budgeted $7 million for SLATS to map the State's land cover and inventory its vegetation. Using digital satellite imagery was the only way to quickly complete the baseline regional vegetation mapping for Queensland and to undertake change detection for many years.
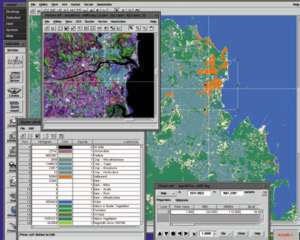
DNR environmental scientists were already using image processing and GIS technology in two laboratories in Brisbane. However, both labs required new software and hardware capable of handling the huge volumes of data SLATS would involve. Esri-Australia Pty. Ltd. in Spring Hill, Queensland, provided ERDAS IMAGINE geographic imaging software for the project. DNR scientists involved in SLATS use this package for all satellite image processing and mapmaking. "DNR chose ERDAS IMAGINE as the primary software because it is multifunctional," said Dr. Gail Kelly, national imaging GIS manager for Esri-Australia. "It has robust classification algorithms, which are critical to this type of mapping project." ArcInfo software is also used to maintain numerous vector files required for land use analysis (e.g., road networks, cadastral information, property names, and lease status). Processing Landsat ScenesThe department has spent $1 million on imagery alone on acquiring over 300 Landsat Thematic Mapper (TM) scenes (a total of 88 TM scenes are needed to cover Queensland for a single date).
"Radiometric correction is one of the main areas where SLATS differs from other projects," said Danaher. "It is much more complicated to radiometrically balance nearly 100 scenes than it is when you mosaic just a few." They wrote a customized correction script in ERDAS IMAGINE, which combines spatial modeling and algebraic functions to create complex models. This enables any DNR technician to run the standardized correction routine on images with the push of one button, dramatically reducing the time needed to prepare images for processing. Classification and change detection are the other two most commonly applied image processing functions conducted in ERDAS IMAGINE. First, a customized semiautomated routine divides the images into classes of similar land cover type based on normalized differential vegetation indexes. Once the images are classified, change detection algorithms compare two images of the same area from different dates to find all land cover types that have changed over time. "These two routines provide DNR with much of the information they need for SLATS," said Kelly. "Classification identifies forested and cleared areas, and change detection pinpoints forest lands that have been cleared from one date to the next." GIS AnalysisDNR scientists have run calculations on the change detection images to determine exactly how much forest land and woody vegetation has been lost since 1989 and where the clearing is occurring. "There is quite a bit of debate over how much of the clearing in Queensland is actually legal," said Kelly. "Tree clearing guidelines differ depending on whether it is conducted on leasehold or freehold lands." Leasehold lands are owned by the government and leased to the public, while freehold lands are privately owned. Determining which type of land has the higher clearing rates will help the government adopt more effective clearing guidelines and employ new policing methods. The IMAGINE Vector Module enables scientists to import ARC vector layers from the ArcInfo database. These layers include the boundaries of the various conservation areas, lease classes, and biogeographic zones. When imported back into ERDAS IMAGINE, these layers are overlaid on the classified satellite images, giving scientists a clear view of where clearing and revegetation have occurred. DNR reports an overall classification accuracy of 95 percent for the project. Taking SLATS into the FutureThe initial SLATS results show that 1990s tree clearing rates have fallen by 21 percent when compared with the late 1980s figures. Additionally, growth of new vegetation may be occurring at about 43 percent of the clearing rate. Lastly, quite a revenue stream has developed for the DNR by making its image maps available to the public. For more information, contact Esri-Australia (tel.: 61-7-3831-3210, fax: 61-7-3831-3214) or visit the SLATS Web site at www.dnr.qld.gov.au/slats. To learn more about "Imaging and GIS," see the sidebar. |
 Greenhouse gas emissions and global warming are hotly debated topics in Australia. The issue is so contentious that in 1994 the Australian government commissioned a National Greenhouse Gas Inventory (NGGI) to rank potential emission causes and pinpoint their geographic sources.
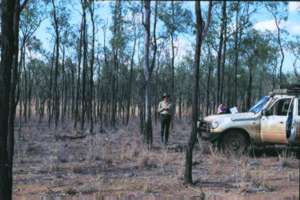 "This project would have been impossible to attempt without satellite imagery and GIS," said Danaher. "Queensland is simply too large an area to map with ground crews alone or even by aerial photography."
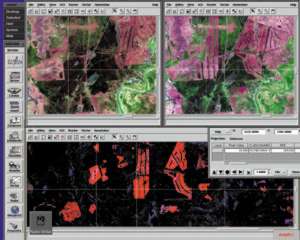 DNR mosaicked the TM scenes to create one seamless image map of Queensland for analysis and presentation. But before the images were joined, they were radiometrically corrected to remove distortions resulting from differences in the atmosphere or satellite orbit from one image acquisition to the next.