
Quick Overlay, Display, and Map Output
Analyzing the Jasper Fire in the Black Hills National Forest
The 2000 wildfire season was one of the worst ever recorded in the Western United States.  In the wake of these devastating fires, public land agencies were left to deal with the inevitable aftermath that ensued. Questions arose among land managers as to how to determine the effects the season had on the landscape. Along with the tragedy of the recent wildfires came an opportunity to show the usefulness of GIS as an analytical tool to study such phenomena.
On Thursday, August 24, 2000, a fire was reported in the Black Hills National Forest just west of Jewel Cave National Monument and several miles away from the Town of Custer, South Dakota. Mapping the fire's location began almost immediately as USDA Forest Service and Park Service  fire crews planned suppression efforts. Fueled largely by shifting winds, the Jasper Fire blazed in several different directions over the next three days covering an area of more than 70,000 acres.
Left: Analysis of the Jasper Fire and the rapid map production and dissemination to firefighting teams used the remote sensing capabilities of ERDAS IMAGINE and the power of ArcView GIS.
On Saturday, August 26, alone, an estimated 48,000 acres were burned. Changes in the fire perimeter were mapped from a helicopter using a Trimble Navigation GeoExplorer 3 unit when conditions permitted. The compactness of the GeoExplorer 3 was well suited for mapping from the air, and the ease with which the data could be converted into an ArcView GIS format allowed for rapid map production and dissemination to firefighting teams. Additionally, ArcView GIS extensions for fire mapping, made available by the California Department of Forestry, provided a method for standardizing fire suppression briefing maps.
Even before the smoke settled, the Black Hills National Forest assembled a team of resource specialists concerned with studying the largest wildfire ever recorded in the Black Hills of South Dakota and Wyoming. Paramount to this issue was determining the intensity of the burn across the 83,000-acre fire. Resource specialists were to then base their analyses on the burn intensity application developed using GIS software. The solution involved using a combination of geospatial techniques and GIS software available to Forest Service GIS specialists. The EROS Data Center, based in Sioux Falls, South Dakota, contributed greatly to this task by providing Landsat 7 imagery of the Jasper Fire from September 5, 2000. By that time, suppression efforts had nearly contained the fire.
Analysis Tools and Field Crews
"The analysis tools were valuable from a manager's standpoint because it provided the credibility needed to make important land management decisions," says John Twiss, forest supervisor, Black Hills National Forest, USDA Forest Service. "People respond very well to the visualizations made available through this technology. It's the visual tools that help us better explain our rehabilitation needs to the public and the Congress."
An initial unsupervised classification was performed using the basic ERDAS IMAGINE 8.3 package with the intent of separating the Jasper Fire area into high, moderate, and low intensity classes. An image combining the 3, 4, and 7 bands was 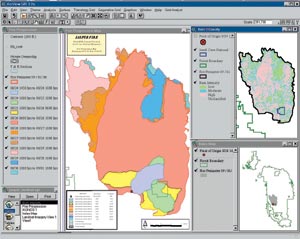 processed using the ISODATA unsupervised classification algorithm and forced into 35 initial classes. These classes were then grouped into one of three intensity levels and checked using aerial surveys by helicopter. Immediately following the initial classification, Forest Service field crews were assembled to obtain ground truth points across the fire. Field crews collected plot locations using Trimble Navigation GPS units and gathered specific burn intensity information at each location. Among the data observed was the dominant tree and herbaceous cover, the estimated canopy cover, the degree of burn intensity of the vegetation (black, brown, or green), and the condition of the soil.
Above right: A final output map using ArcView GIS showing a fire progression map and a burn intensity map.
When overlaid with both the classified image and the raw satellite data, these plots provided valuable information and helped analysts train the satellite to pick out the different degrees of burn intensity more precisely. In reference to the initial classification, the high and low intensities seemed fairly accurate; however, the moderate class appeared to be incorrect in several places.
Says Twiss, "We used these tools to explain burn intensity to the timber industry, environmental groups, elected officials, and the public so that they understood the basis for our management decisions in dealing with the Jasper Fire."
Saving Tens of Thousands of Dollars
With IMAGINE 8.3, a subset containing the moderate class was separated into 20 classes through an additional unsupervised classification. This process sufficiently pinpointed areas of high or low intensity initially considered moderately burned. Once a final burn intensity classification was developed, this data was converted into an ArcInfo coverage and used for geographic analysis with numerous other GIS layers. The burn intensity coverage revealed a patchwork of differing burn intensities, suggesting that the Jasper Fire was in many places a healthy burn for the ecosystem. Results from this analysis included the percentage of watersheds affected, soil erosion potential, changes in wildlife habitat structure, cultural heritage sites disturbed, and location of possible salvage activities.
"Dead trees within the fire area will rapidly lose value," says Robert J. Thompson, Mystic District ranger, Black Hills National Forest, USDA Forest Service, "and will be essentially worthless within a one-year time frame. The use of GIS analytical tools saved significant time in preparing environmental analyses and required public disclosure documents. This has saved tens of thousands of dollars in administrative costs and could affect the ability to recover millions of dollars worth of dead timber that otherwise would not be recovered."
The ability to integrate geospatial technology and data from different vendors and entities has been invaluable to the burn intensity analysis process for the Jasper Fire. Utilizing ArcView extensions, such as IMAGINE Image Support, allowed quick overlay and map output of various geospatial products including Landsat 7 imagery, USGS Digital Raster Graphics, and Digital orthoquads with the existing Black Hills GIS library. Cooperation among agencies, especially between the EROS Data Center and the Black Hills National Forest, was essential to the analysis process. Solutions developed through interactions of technologies, people, and agencies have shown the need for more GIS involvement in fire suppression and analysis efforts in the future.
"The GIS map products proved invaluable to the fire team in determining fire suppression tactics and sharing timely information with evacuated residents and the general public," said Thompson. "The ability to quickly map and display information using GIS tools enabled the Forest Service to rapidly assess the fire's effects and prioritize rehabilitation and public safety efforts."
For more information, contact Thomas M. Gushue, GIS specialist, USDA Forest Service, Black Hills National Forest (tel.: 605-673-9262, e-mail: tgushue@fs.fed.us).