
GIS in the Water/Wastewater Industries of Mexico, Russia, South Australia, and West Java
GIS Goes with the Flow
The use of GIS technology is rapidly expanding in the water/wastewater industry, moving from project-specific implementation to full enterprisewide installations. The 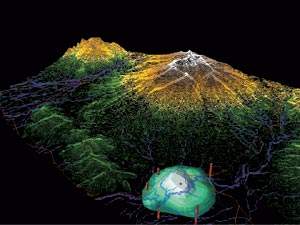 growing trend in GIS implementation in the industry is toward system operations. Increasingly, it is being integrated into overall maintenance operations while moving away from exclusive use by an organization's planning department.
Right: The South Australian Water Corporation integrates its Digitized Facilities Information System with Esri's ArcView GIS and ArcView 3D Analyst software to produce three-dimensional images revealing the extent of groundwater depletion and pollution in regional water basins.
In the past, map books had to be carried into the field to perform maintenance operations such as damage repair. Someone had to sit down with these books and trace which valve had to be shut down in order to isolate the line before it could be repaired or replaced. In some cases, there are thousands of pages of maps. If field-workers use simplified versions to reduce confusion, they do not have all of the information available in the more detailed maps.
To overcome this problem, GIS is increasingly being installed on laptop computers for use in the field. This allows full access to updated digital maps when performing work order and other maintenance operations. With the implementation of GIS in the field, the detailed maps are available to staff for rapid on-site query and analysis. This reduces the number of telephone calls and trips back to the office to locate necessary records. Getting better information faster to people in the field results in both better service and increased cost savings.
Another use of GIS that is helping the water/wastewater industry function more efficiently is its linking with hydraulic models. Information can be passed between the GIS and the model, which simplifies the tremendous effort that it takes to create and refine a model. GIS is also used for analysis and simulation on the water network prior to adding any new components to it such as a change in the diameter of a pipe, the installation of a water storage facility, or the alteration of pressure on a particular valve. GIS is being used more and more for network expansion in determining the location of existing lines and planning where new ones should be added. Water quality measurements can be included in the GIS, which allows a better understanding of where water quality problems might exist. It is also being used for inventory management and project tracking.
There is a growing trend for organizations to exchange georeferenced data, which also helps expand the use of GIS technology. A greater number of interexchange agreements are being developed, principally between governmental agencies, but increasingly between private and semiprivate organizations as well.
According to the American Water Works Association, close to 90 percent of all water utilities in the United States were using GIS technology by the end of the year 2000. And, thanks to international funding organizations such as the World Bank and Inter American Development Bank, the water/wastewater agencies in developing countries throughout the world are implementing GIS as part of their corporate IT strategy.
GIS Keeps Agua Dulce in Mexico
The Sistema de Agua Potable y Alcantarillado de León (SAPAL) in León, Mexico, began its GIS implementation in 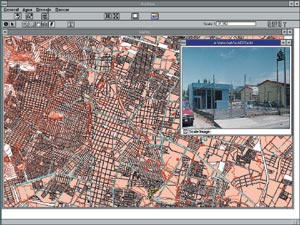 1993 with a small cadre of professionals who brought with them some computer-aided drafting experience.
Left: Using ArcInfo and ArcView GIS, Mexico's SAPAL has produced a variety of facility management, infrastructure inventory, and map production applications.
"We are currently working on a complete inventory of our water system," says Ernesto Enei Chi, GIS manager at SAPAL. "We are including fittings, pipes, pumps—everything—into the GIS. This will allow us to associate each component in our system with related statistical information and its service history to provide better service to our customers. Soon we will do network simulations."
After about two and one-half years of data collection and refinement, SAPAL began developing applications. Using Esri's ArcInfo and ArcView GIS, the company produced a variety of facility management, infrastructure inventory, and map production applications.
"GIS has made an enormous impact throughout the company," says Enei Chi. "It affects almost all areas and activities. It has provided us with a different way to look at things, which has allowed us to solve problems more quickly. It has also helped improve our methods of operation, our procedures, and our approach to technology."
However, the primary challenges during the first year really had much more to do with public relations than technical issues.
"We realized that our main obstacle to implementation concerned the users and the data they controlled," observes Enei Chi. "Some thought that we wanted the data so we could usurp their jobs, and others felt that the data they worked with belonged to them. We explained that by automating the information it would be more accessible to everyone, which would make all of our work easier. Slowly we were able to convince them of the benefit of GIS, and we began building our databases."
For more information, contact Lori Armstrong, Esri (e-mail: larmstrong@esri.com).
Russia Uses GIS to Compare Water Quality with Disease Clusters
For the past three years, the Centre for Preparation and Implementation of International Projects on Technical Assistance (CPPI), headquartered in Moscow, has been implementing a GIS for environmental management in the Yaroslavl region of Russia using ArcView GIS.
Specialists have begun comparing water pollution and water quality data for the drinking water reservoirs in the region with the incidences of liver and kidney illnesses in the districts adjacent to the tested reservoirs. Criteria include the number of water legislation violations that were detected by environmental officials, a comparison of estimated and documented environmental damage, and real changes in water quality according to water sampling data.
Similar systems are planned for the Vologda, Kostroma, and Ivanovo regions. In addition, water quality simulations are planned for major Russian rivers, commencing with the Volga.
Simon Obridko, GIS expert at CPPI, comments, "Up until now, we have relied on expert opinion in evaluating a causal link between water quality and the general health of local residents. A strong influence cannot really be proven without water simulation models for all parts of our reservoirs. At a later date, we hope to implement MIKE 11 GIS from the Danish Hydraulic Institute. This software integrates numerical river modeling with ArcView GIS, which will provide us with enhanced simulation capabilities."
For more information, contact Lori Armstrong, Esri (e-mail: larmstrong@esri.com).
South Australia Enhances Water Utility Operation with GIS
As a result of more than 16 years of experience in the development, enhancement, and use of spatial technology for water utility operations, South Australian Water  Corporation (SA Water) in Australia has developed the Digitized Facilities Information System (DFIS) based on an application development framework (ADF), an extensive ArcInfo toolkit, and ArcView GIS.
Right: The South Australian Water Corporation has developed software to extract digital data sets that are used by developers for conceptual water and wastewater system design.
DFIS is used to capture, maintain, update, and analyze all of the water and wastewater reticulation asset information throughout South Australia. SA Water has been an enthusiastic adopter of spatial technologies to deliver corporate information, and has been at the forefront of Web integration. Its Intranet site receives an average of 11,000 hits per day and anyone at SA Water can access the corporate spatial data, including water and sewer map data, as well as images of as-constructed drawings using a simple Web browser.
SA Water has detailed data in DFIS on more than 32,000 kilometers of water and wastewater mains, together with associated fittings such as water and wastewater treatment plants, reservoirs, pumping stations, tanks, valves, manholes, and household drains. This data has been integrated with records of more than 800,000 land parcels and more than 700,000 digital images of pipe.
SA Water has developed software to enable the production of digital images of standard 1:2,500-scale water and 1:1,000-scale wastewater plans covering the State's entire reticulation networks. The more than 10,000 digital images available to DFIS users have streamlined the access to information not only for staff members but also to external agencies, local government authorities, and others.
Software has also been developed to produce suites of digital images that are required to support the processing of land division proposals. This software enables the user to enter the appropriate proposed land division number, which allows the display of a series of digital plans showing existing land boundaries and water/wastewater mains. This software also extracts digital data sets that are used by developers for conceptual water and wastewater system design.
For more information, contact Alex Gunjko, regional manager at Esri-Australia (Adelaide) (e-mail: adelaide@esriau.com.au).
Developing the West Java Bulk Water Master Plan
The South Australian Government, in conjunction with SA Water and its Digitized Facilities Information System (DFIS) technology (see "South Australia Enhances Water Utility Operation with GIS"), is assisting in the development of a master plan, or Pola Induk 1, as it is referred to in Indonesia, for the Indonesian province of West Java.
The rate of industrial and urban expansion in West Java is the fastest growing in Indonesia, and the development of clean water sources must grow at a similar rate to guarantee an adequate supply of water to the province's 42 million residents. The autonomous region of Jakarta, with a population of 15 million, also depends on West Java for its bulk water supplies.
The project includes coordinating West Java's data capture program into an integrated approach taking into consideration the environment, socioeconomic climate, urban development, industrial development, and the tourism industry.
The master plan will be used for the design, construction, and operation of wastewater treatment plants, flood mitigation, clean water supply, the development of flood prone land, and bulk water storage.
Before the master planning process began, there was no coordinated overview of water systems in West Java. Data that did exist tended to be in the form of hard copy plans dedicated to a single river basin and did not link areas of supply and demand.
In stage one of this project, SA Water used DFIS to monitor the province's bulk water needs, wastewater treatment facilities, and clean water distribution. By integrating DFIS with Esri's ArcView GIS and ArcView 3D Analyst software, three-dimensional images were produced that revealed the extent of groundwater depletion and pollution in regional water basins.
Because the DFIS system incorporates three-dimensional maps, photographs, and video footage of water treatment plants and other infrastructure, it enables engineers, planners, and local communities to visualize problems and plan for the future without the need for extensive technical expertise.
Jim Carlson-Jones, manager of spatial engineering at SA Water, believes that DFIS is "crucial to the success of the water/wastewater master plan in West Java and instrumental in improving the quality of life for the millions of people living there."
For more information, contact Alex Gunjko, regional manager at Esri-Australia (Adelaide) (e-mail: adelaide@esriau.com.au).