
Assessing Tornado Damage Risk for Dallas-Fort Worth, Texas
Tornado Alley "What If" Scenario Brought to Life with GIS
How would an urban area fare if it suddenly found more than 30,000 structures and 80,000 residents in the direct path of one of the monster class tornadoes that develops 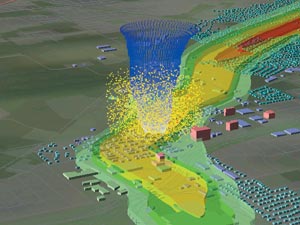 in the United States almost every year? The incredible damage in the suburbs of Oklahoma City, Oklahoma, in 1999 forced many urban areas to consider just that. North Central Texas, less than 200 miles to the south, took particular notice.
Right: Modeling developed through ArcView 3D Analyst provides ways to track the path of a tornado.
It was another in the growing list of major bullets dodged by Dallas-Fort Worth, the largest populated area in "tornado alley." Devastating tornado outbreaks have occurred within 100 to 200 miles in nearly all directions from the Dallas-Fort Worth Metroplex—most within the last 20 years and several within the last five years. The area itself has experienced more than 130 separate tornadoes since 1950. It is only a matter of time before one or more track across the Metroplex with the kind of strength that other areas have been seeing.
"It is not a question of if, but when," stresses Jim Stefkovich, warning coordination meteorologist for the National Weather Service in Fort Worth. After seeing the Oklahoma results, many wondered how Dallas-Fort Worth would have fared. The continual progress in the development of urban geographical databases for the Metroplex has made it possible to estimate the impact of such a class of storm outbreak.
The North Central Texas Council of Governments (NCTCOG) and the National Weather Service in Fort Worth have put together a Tornado Damage Risk Assessment, which 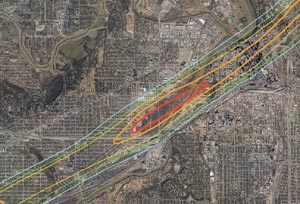 estimates the results of multiple scenarios in which the Oklahoma tornadoes are transposed across the Metroplex. In five of the scenarios (see table below), 53 damage paths from the Oklahoma tornadoes were laid atop Metroplex geographical data. The paths were mapped with ArcInfo and included the actual damage contours from the most powerful tornado in Oklahoma City, surveyed by the National Severe Storms Laboratory. The paths were projected together slightly north-south and east-west across the Metroplex in each scenario to provide variety to the tornado paths.
Above left: In the North Texas scenarios, the largest of the Oklahoma tornadoes covered a significant urban area. Aerial photograpghy provided an effective means to appreciate the damage path.
| Total Damage Estimates for the Five Scenarios | |||
| Scenario | Structures Impacted* | Property Value in Path | Potential Damages |
| 1 | 17,070 | $1,630,613,000 | $811,000,000 |
| 2 | 14,363 | $1,652,263,000 | $790,000,000 |
| 3 | 23,380 | $4,188,993,000 | $2,652,000,000 |
| 4 | 30,887 | $5,013,443,000 | $2,808,000,000 |
| 5 | 38,463 | $5,064,222,000 | $2,859,000,000 |
ArcInfo served as the geographic processing engine for the study, while ArcView GIS was the tool by which the data was mapped and manipulated for effective presentation of the results. ArcView 3D Analyst was used to construct several models and animations that put to rest any doubts of the area's susceptibility to a long-track violent class tornado. Several animations followed a 3D representation of a tornado along a 37-mile path of the most damaging tornado, with more than 20,000 actual building polygons mapped and extruded along the route. Mathematical and query functions along the route, mostly written in Avenue, dynamically sampled the underlying data and provided a frame-by-frame analysis of the geographical profile within the tornado's impact area.
Appraisal records, land use classifications, demographic data, employment centers, building locations, and data from aerial photographs were merged into a 400,000-record 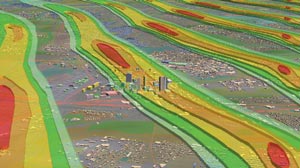 ArcInfo data set upon which the tornado paths were overlaid. The data set featured an extensive blend of detailed densities, values, parcels, and other data—merged with the wind damage contours to provide small-scale area descriptions. Transportation modeling was used to estimate the number of vehicles threatened on major routes in the path. The goal was to provide a best guess of how much property and how many people could be in the path of the tornadoes in each of the scenarios.
Above right: Multiple tornado paths running across the Dallas-Fort Worth area provided a path-by-path comparison of urban development and demographics that could be impacted by a tornado.
It was a clear example of how trends in Dallas-Fort Worth development reveal themselves in very specific area boundaries and pathways. For every step along each tornado damage path, ArcInfo and ArcView GIS were used to estimate the number of structures, their appraised value, the number of residents, the number of employees, and the estimated vehicular traffic—and grouped them by tornado damage contour. Potential damage dollars were calculated by considering structure category and wind velocity at each location. If the multiple scenarios showed a trend toward high structure numbers and population in the paths, it would certainly stress the importance of good warnings, public action, and city preparation.
In addition to the five primary scenarios, a smaller subset of tornado paths (which included the most powerful tornado in the outbreak) was mapped 50 times side by side in 2.5-mile increments across the core of the Metroplex. This group of 50 tornadoes would significantly tap into the sprawling urban geography of the Metroplex. Structures and population in the path were estimated for each of these 50 more specific tornado groups.
The Results
When the scenario tornadoes crossed through the urban core of the Dallas-Fort Worth Metroplex, estimated property damages quickly approached the $3 billion mark. The number of housing units and commercial structures in the urban paths reached upwards as high as 38,000. At least 15,000 single-family homes would have been damaged in each of the urban core scenarios. One scenario placed as many as 84,000 residents in the path of the tornadoes, and another identified about 94,000 people working in the buildings in the tornado paths. A traffic jam in such an event could put as many as 87,000 vehicles at risk—up to 30 times more than might be expected under normal traffic flow conditions.
Of the 50 subset paths, 38 would have at least $1 billion of property in their paths. As many as seven of the paths would surpass the $5 billion mark. Thirty-eight of the 50 paths would have at least 10,000 structures and apartment units in the path, with 10 having more than 30,000. More than half of the paths would have at least 50,000 people living in the impacted residential structures.
The "Real Thing"
Ironic to the study's timing, a significant scale tornado struck the downtown core of Fort Worth, Texas, on March 28, 2000. Damage from the tornado was extensive. Downtown  skyscrapers were hit directly by a tremendous cloud of debris. The images of 40-story buildings with thousands of shattered windows will be forever etched in the history of North Central Texas.
Right: Some damage from an actual downtown tornado strike to Fort Worth on March 28, 2000.
The "real thing" reinforced an important finding of the study—tornadoes touching down in major developed areas can cause significant damage and run up big bills quickly. Even though this storm covered only one-twentieth of the area and was less than half the strength of the Oklahoma tornado used in the model, it has produced damage estimates that are reported to be several hundreds of millions of dollars.
As the Dallas-Fort Worth Metroplex continues to grow and develop, the odds of such events having an impact on the area will continue to increase. Long-tracked violent tornadoes do occur in this region of the country, and based on one that actually occurred less than 200 miles to the north, the layout of the Metroplex reveals multiple possible damage paths with tens of thousands of structures, residents, and employees at risk. Ultimately, it will be very difficult for such a storm not to generate high damage numbers.
For cities, it is simply a case of planning smartly and not being caught unprepared. "When a disaster does occur, the cost of recovery and mitigation of that disaster can be devastating if the planning before the event has not been proactive and effective," adds Jack Tidwell, senior environmental planner at NCTCOG. "The information collected on potential disaster events can shape and fine-tune decisions made in the overall planning and development of a community."
Geographically, land use makes a big difference in the ultimate impact from a storm. GIS provides an ideal way to track the changes in the urban balance between vacant and developed land. The more the scale tilts toward developed, the more communities in "tornado alley" will need to watch out for touchdowns and be prepared to react.
For more information, contact Scott Rae, NCTCOG (tel.: 817-695-9154, e-mail: srae@dfwinfo.com). The study results can be found on the NCTCOG Internet site at www.dfwinfo.com/weather/study.html.