


|
|
||
|
|
|
|
|
|
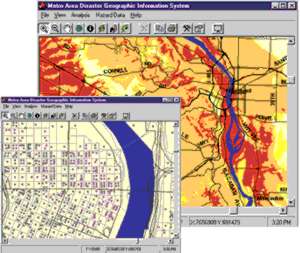
Application Built with MapObjects Helps Oregon Local GovernmentsMAD GIS Helps Visualize Natural Hazard Risks
The Metro Area Disaster Geographic Information System, or MAD GIS, is designed to assist certain local governments in Oregon to prepare for, and in the future perhaps respond to, such disasters. MAD GIS is an easy-to-use software application built with Esri's MapObjects and Visual Basic (VB). Using it, emergency management planners can produce maps showing the vulnerability of people, the built environment, and natural resources to earthquakes and floods. MapObjects with VB provided the right tools to create a specialized desktop application that emergency management planners can use with minimal training. It also enabled spatial analysis on average-powered desktop PCs, and the per-seat cost was relatively low. MAD GIS can be used in many ways. For example, it can help identify zones for new construction that need site-specific hazard investigations. It can create maps and inform the development of risk-based standard operating procedures for assessing damage along regional emergency transportation routes. MAD GIS also can help prioritize preventative and early recovery strategies for vital systems such as electricity, gas, and water that cross jurisdictional boundaries. This project was inspired by the experiences of an emergency management planner and made possible by a unique partnership of local, regional, State, and federal governments. After attempting to manage local government responses to four major disasters in California, Mike McGuire realized that organizing emergency response information in the aftermath of a disaster is virtually impossible. "GIS seemed like the perfect tool to organize the 'Wall of Noise,'" says McGuire, "so you can pick out essential elements of information, organize it, and make management decisions quickly." GIS also facilitates emergency management planning prior to natural disasters because it helps capture, illuminate, analyze, and display complex information in comprehensive, integrated and meaningful ways.
Since 1993, Metro has forged a partnership of local, regional, and State governments to identify earthquake hazards and assess the associated risks to people and the built environment. The Oregon Department of Geology and Mineral Industries (DOGAMI), the State Office of Emergency Management, and Metro obtained funding for this software development project from the Federal Emergency Management Administration (FEMA). DOGAMI compiled local data describing relative earthquake hazards throughout the metropolitan region based on slopes, soil liquefaction, and expected soil response to ground motion. Subsequently, Metro, with assistance from Portland State University and the City of Portland, obtained data on the potential seismic response of commercial buildings within the region. Metro commissioned GeoNorth, a technology integration firm specializing in GIS and databases, to design and build this application. Using MapObjects software's rich set of developer objects, GeoNorth was able to create an application with powerful query capabilities, and one that provides the opportunity to integrate tabular data with GIS data layers. Such functionality enables planners to explore complex relationships. For example, MAD GIS can be used to show where schools are located in relation to earthquake hazards or where hazardous materials sites are located in relation to landslide hazards and floodplains. At the touch of a button, the MapObjects-VB solution creates an intuitive yet detailed map showing hazardous areas. For more information, contact Mike McGuire, senior emergency management planner, Metro, 600 NE Grand Ave., Portland, Oregon 97232 (E-mail: mcguirem@metro.dst.or.us) or Kellie Hauger, GIS analyst/programmer, GeoNorth, Inc., 921 SW Washington, #316, Portland, Oregon 97205 (tel.: 503-827-0827, fax: 503-827-0735, E-mail: khauger@geonorth.com). |
 Disasters such as earthquakes, floods, and fires can turn urban environments upside down. One moment, the systems built to tame our environment operate almost invisibly; the next, we may depend on the heroic efforts of strangers to restore basic urban services that provide safety, comfort, and a foundation for our economy.
 McGuire is now a senior emergency management planner at Metro in Portland, Oregon. Metro is an elected regional government that serves more than 1.3 million residents in the Portland metropolitan region. Metro works in partnership with local emergency managers to address regional issues related to disaster response and coordination. Metro participates in the Regional Emergency Management Group which brings together local emergency managers for planning purposes. The primary goal of Metro's Natural Hazards Program is to understand and prepare for natural hazards and disseminate hazards information to local agencies.