
Spatial Data Exploration Extension for ArcGIS
Introducing Geostatistical Analyst
Geostatistics has long been a highly specialized and highly valued field focused on surface modeling of point information and assessment of error probability of resulting surfaces. ArcGIS Geostatistical Analyst is a new extension to ArcGIS 8.1 that 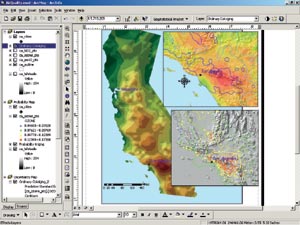 implements these sophisticated and powerful modeling tools within a GIS. The implementation provides a dynamic environment for spatial data exploration and allows users to identify data anomalies, evaluate error in prediction surface models, conduct statistical estimation, and, most importantly, create optimal surfaces.
Right: Geostatistical Analyst provides accurate surface creation with advanced geostatistical interpolation methods and an entirely new friendly wizard interface.
Applications include determining areas of possible mineral resources (oil/gas) to assessing possible environmental risks. The Geostatistical Analyst gives users the freedom to investigate, visualize, and create surfaces and perform sophisticated analysis. The Geostatistical Analyst builds upon the basic surface creation introduced in the Spatial Analyst extension by implementing an exploration environment and providing advanced interpolation methods for optimal surface creation. The geostatistics methods are implemented in a highly interactive and visual environment.
Explore Your Data
Geostatistical Analyst incorporates exploratory spatial data analysis (ESDA) tools for examining data peculiarities such as distribution, global and local outliers, trends, spatial autocorrelation, and covariation among multiple data sets. ESDA can also be used for determining which geostatistical interpolation method is appropriate for your data. ESDA is implemented with ArcMap, providing users with the capability to visually explore the data for further analysis.
Advanced Surface Creation with Friendly Wizards
A series of wizards and dialog boxes assist users in determining the values for the parameters specified. Some of these dialog boxes and tools are applicable to almost all 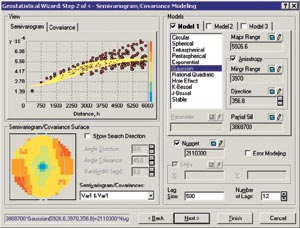 interpolation methods such as specifying the search neighborhood, cross-validation, and validation. Others are specific to the geostatistical methods (kriging and cokriging) such as modeling semivariograms, transformations, detrending, declustering, and checking for bivariate normal distributions. All of these tools help you develop a statistically optimal surface for your data. And the introduction of the error modeling concept in ArcGIS Geostatistical Analyst allows creation of more accurate surfaces, with data containing measurement errors.
Above left: Users may adjust advanced analytical options such as anisotropical influences and error modeling.
Perform Diagnostics
After choosing the parameters for the model, it is useful to recognize if the model is optimal for the particular data set. ArcGIS Geostatistical Analyst provides cross-validation and validation tools that allow evaluation of the surface. The tools quantify the "accuracy" of the model. You can either accept the model and its parameters, or you can refine the parameters of the model to create a better surface. Cross-validation and validation help you make an informed decision as to which model provides the best predictions. The calculated statistics serve as diagnostics that indicate whether the model and/or its associated parameter values are reasonable.
ArcGIS Geostatistical Analyst is much more than an interpolation software package—it provides a dynamic environment with a wide variety of tools for data exploration, and a friendly wizard environment for optimal surface creation. Geostatistical Analyst gives you the power to fully understand the qualitative and quantitative aspects of your data. By providing you with the freedom to statistically predict and model spatial phenomena and incorporating powerful exploration and visualization tools, Geostatistical Analyst effectively bridges the gap between geostatistics and GIS.
For more information, visit www.esri.com/geostatisticalanalyst or call Esri at 1-800-447-9778. To purchase ArcGIS Geostatistical Analyst in the United States, visit http://store.esri.com, call Esri at 1-800-447-9778, call your Esri regional office, or contact your local reseller. Outside the United States, please contact your local Esri distributor.
Features Available in ArcGIS Geostatistical Analyst
| ESDA |
|
| Deterministic Interpolation | |
| Geostatistical Methods and Tools | |
| Others |