


|
|
||
|
|
|
|
|
|
GIS Strikes Gold at Summer Olympics
Sydney Harbour officials took it all in stride. The harbour is big, and a sailing event, even if it is the largest in the world, would not dramatically affect its busy shipping lanes and cross-harbour traffic. However, to allow itself this measure of complacency, the Sydney Organizing Committee for the Olympic Games (SOCOG) joined forces with the government and private enterprise immediately after being informed of its successful bid to stage this year's Olympics. Together, they mapped out a comprehensive strategy to stage a truly millennium-scale sporting event. Waterways Authority NSW is the governmental agency responsible for protecting and managing Australia's navigable waters. Waterways monitors recreational and commercial boating and wetland property issues. Waterways is also responsible for water safety and education, enforcement of marine laws, as well as environmental legislation and regulations. Sydney Harbour falls squarely under the jurisdiction of Waterways. As a matter of fact, the agency actually owns the bed of the harbour and therefore has a keen interest and responsibility for any and all harbour-related activities. "Our responsibility for the Olympics was to provide SOCOG with uninterrupted areas to run their sailing events," comments Rob Colless, graphical systems manager at Waterways. "We had a major role in helping to plan for this part of the Olympics, and that's where GIS technology comes in." To accomplish this required integrating a variety of sources of information, for which Waterways used MapObjects, Esri's developers' software that includes embeddable mapping and GIS components, allowing the creation of dynamic live maps with GIS capabilities. Maps were viewed with ArcView GIS, which also hot linked related photos, videos, and text to the map display. Waterways made extensive use of its Intranet, which was powered by ArcView Internet Map Server and used to automatically distribute vital information concerning harbour activities to those monitoring the various Olympic events. This allowed them instant access to ongoing races so that, in the event of any disruptions to a race, an immediate response could be mounted. Sydney Harbour in 3D"We built a three-dimensional model of the whole of Sydney Harbour," Colless continues, "which is based on hydrographic soundings from more than 100 years worth of soundings records."
Above left: Sydney Harbour arrangements for Olympic games prepared by the Waterways GIS Section viewed with ArcView GIS. "The model really saved us a lot of time," Colless continues. "Previously you would have to go out to the location, check the depth, cut the rope, and then lay each buoy in position. Also, if any of the buoys got pulled out of position, the model allowed us to easily get them back into position because we had captured the coordinates." Commercial Shipping ContinuesBecause Sydney Harbour continued its commercial shipping and other operations during those periods in which Olympic events were not scheduled, the "We have radio communication and GPS tracking devices on most of our major vessels, and information was relayed back to SHOC headquarters via a mobile telephone network," explains Colless. "That information was read directly into the GIS and our Incident Management software so that we could see instantly where our vessels were and where they should have been to properly monitor, manage, and respond, if necessary. We recorded anything that could possibly have an effect on the racing events such as a whale entering the harbour, a capsized boat, or spectators breaching the exclusion zones. This is where the GIS mapping was very important, because with real-time GPS we could pinpoint where an incident occurred and then instantly create a map of it to assist in taking remedial actions, as well as include the map in our incident record."
Live feeds to the Internet had been banned by SOCOG because they would contravene and disrupt the telecast policies and arrangements with the sponsors of the Olympics. Above left: The Waterways Authority has radio communication and GPS tracking devices on most of its major vessels, and information is relayed back to SHOC headquarters via a mobile telephone network. "We were very excited about the opportunity to stage this part of the Olympics in our harbour," Colless concludes. "It meant that many people who had never had the opportunity to view a sailing event before had front row seats. Considering that world-class sailors were competing, it was very exciting. We believed that with the use of GIS technology our visitors were rewarded with an exciting, but safe, Olympic experience." For more information, contact Rob Colless, graphical systems manager at Waterways (e-mail: rob@waterways.nsw.gov.au). |
 Hosting the XXVII Olympiad was no small task, even for Australia, a country where everything seems to be just a little larger than the norm. For instance, the entire sailing event for Olympics 2000 was staged for the first time in a harbour, allowing spectators to view races that have, up until this point, always been staged in the open ocean.
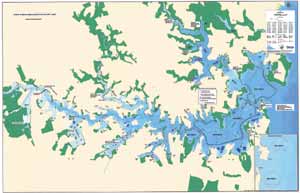 Because the model includes position and depth information, Waterways was able to use it to set up a series of exclusion zones around the harbour. The coordinates were then supplied to the crews laying buoys around the exclusion zones, who used GPS to locate each position. Because depth information was included, they could easily cut the right length of rope, attach it to the buoy, and drop it into position.
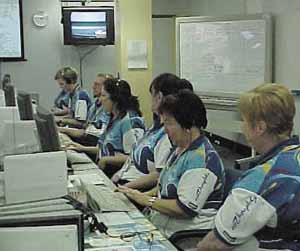 Sydney Harbour Operations Center (SHOC) was set up. Waterways Authority, water police, and the National Parks and Wildlife Service, as well as representatives from other harbour-affiliated organizations, staffed SHOC to manage all activity in the harbour.
 Waterways also strategically placed video cameras around the harbour to record any mishaps. This live video feed was used for monitoring purposes and included in the incident record.