


|
|
||
|
|
|
|
|
|
A Case Study in GIS ModelingSaving the Salton Sea
Because other California wetlands are being destroyed, the man-made Salton Sea has become important as a wildlife refuge for fish and birds. More than half the birds using the Pacific Flyway, a bird migration route from Canada to Mexico, now stop at the Salton Sea. It was designated a National Wildlife Refuge in 1925 and has become a home for many endangered species including desert pupfish, brown pelicans, peregrine falcons, and bald eagles. The Salton Sea is also a fishery and recreational area. The Problem
The Salton Sea fishery is predicted to collapse within the next 15 years if nothing is done to reduce the salinity. Fish and birds are dying in large numbers. Once-thriving resort communities are having trouble attracting tourists because of dead fish and birds, poor water visibility, and odor from large algal blooms. Working Toward a SolutionIn 1992, Congress created the Salton Sea Authority to restore the sea. The Salton Sea Authority includes local, state, and federal agencies, as well as representatives of the Torres Martinez Desert Cahuilla Indian Tribe, the major landholders in the Salton Sea area. The Salton Sea Authority has been working with the California Department of Water Resources and the Bureau of Reclamation to reduce salinity in the Salton Sea to ocean level. Proposals include constructing dikes and concentration ponds to trap salts and pumping saline water out to nearby dry lake beds.
Using ModelBuilder, they created their model and ran it to generate a map showing the most suitable areas to construct a pipeline. A simplified version of the model the university team created is shown here. Defining the Data and ProcessesThe model included the following data requirements and processes: Land use--Land use data in the Salton Sea area was reclassified as rural or urban. Farms, ranches, and vacant lands were reclassified as rural, and Business and residential districts were reclassified as urban. Rural areas are preferred over urban areas for constructing pipelines because land is cheaper and there are fewer buildings in the way. Structures to be avoided--Locations of schools, universities, medical facilities, and prisons were mapped. Buffer zones were created around the structures that the model would not allow pipelines to cross. The output maps from these buffer processes were combined by adding the buffer zones together to create the Combined Facilities map. Structures to be favored--Major roads, transmission lines, and railroads are favorable paths for pipeline construction. The right-of-way permits already exist, utilities for construction are likely to be available, and the land is already graded. Buffer zones were also created around these structures, but this time the model would favor them when finding the most suitable paths. Hydrologic considerations--Canals make good paths for pipelines because a right-of-way has already been established, but streams should be avoided because they are expensive to cross and easily damaged. In a process called weighted overlay, the canals and streams are given weights according to whether they make good paths, and that data is put together to create the Combined Hydrology map. Natural hazards--Two major faults, the San Andreas and the San Jacinto, border the Salton Trough, and many smaller faults crisscross it. The model creates buffer zones around faults so that these areas will be considered unsuitable for pipelines. Slope--The steeper the terrain, the more it costs to build pipelines there. The model converts a digital elevation model (DEM) file, a standard format for elevation data, into grid data, a standard format for ArcView Spatial Analyst, and then converts it to a slope map. Putting It All TogetherIn a final weighted overlay process, the intermediate maps are weighted by how much they contribute to the cost of construction, and then the maps are combined. The final result is a suitability map, which shows the most suitable areas for construction of the desalinization pipelines, given the input data and constraints. When the model is run, it creates the suitability map in ArcView GIS. The University of Redlands team then converted the suitability map into a least-cost path map, which shows the paths with the lowest construction costs. The final map they presented to the Bureau of Reclamation is shown. In the map you can see the paths that are least expensive for pipeline construction. The red areas are the dry lake beds where the saltwater could be pumped. How ModelBuilder PerformedThe university team designed the pipeline suitability model in four days. It would have taken them weeks to build a model this large without ModelBuilder. The team could come up with ideas to improve the model and test them immediately. They could increase the importance of avoiding streams or decrease the importance of being near transmission lines and then rerun the model to get new results, all in only a few minutes. ModelBuilder allowed them to spend more time thinking and less time adjusting the model. The University of Redlands and the Bureau of Reclamation compared the least-cost paths created using GIS tools with those created by hand by engineers working with paper maps. Most of the paths in the two models matched, but a few of the paths differed. The engineers working with paper maps decided that in some areas it would be less expensive to tunnel through steep slopes rather than go around them. The university team could add this constraint into the GIS model and run it again without redoing all their work. This article was adapted from GIS for Landscape Architects by Karen C. Hanna, now available from Esri Press. GIS for Landscape Architects also includes a detailed chapter on the GIS Graphic Method developed by the author to make GIS concepts accessible to landscape architects. It is available at better bookstores, online at www.esri.com/esripress or www.esri.com/gisstore, or by calling 1-800-447-9778 (ISBN 1-879102-64-1, PN 82930, $19.95). For more information about this case study, contact Susan Crow, Esri (tel.: 909-793-2853, ext. 1-1885; e-mail: scrow@esri.com). For more information about ArcView Spatial Analyst 2 with ModelBuilder, call Esri at 1-800-447-9778 or visit www.esri.com/spatialanalyst. To purchase ArcView Spatial Analyst, contact your local reseller, call Esri at 1-800-447-9778, or call your Esri regional office. Outside the United States, please contact your local Esri distributor. |
 The Salton Sea, California's largest inland water body, was accidentally created in December 1904 when a levee broke along the Colorado River. It took two years for engineers to stem the flow of water into the Salton Trough, a desert area more than 200 feet below sea level, and during that time a huge lake formed. The Salton Sea is currently 35 miles long and nine to 15 miles wide.
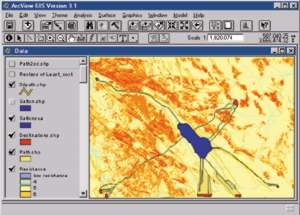 The Salton Sea is dying. Originally a freshwater lake, it has become approximately 25 percent more saline than the Pacific Ocean, and the salinity continues to rise. Freshwater does flow into the Salton Sea from agricultural runoff and streams, but there is no outlet to the Pacific Ocean to remove water and dissolved salts. The water level is maintained through evaporation in the hot desert climate. But as the water evaporates, it leaves behind salts that increase the salinity.
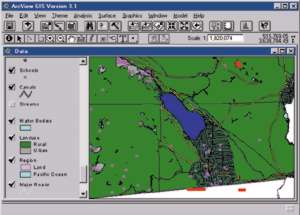 The Bureau of Reclamation commissioned the Center for Environmental Management, University of Redlands, Redlands, California, to see if GIS technology could be used to help save the Salton Sea. The university used the ModelBuilder functionality included in