


|
|
||
|
|
|
|
|
|
Urban Growth Along South Carolina's CoastThe Tri-County region of Charleston, South Carolina, comprised of Berkeley, Charleston, and Dorchester counties, covers about 1.7 million acres (almost 10 percent of the State's land area). In the last 10 years, the region has experienced tremendous urban expansion, with 95 percent of the State's population growth a result of the increased coastal access via Interstate 95. With the emphasis on attracting more industry and Business to boost the local economy and the State's expected population increase from 3.5 million to 4.5 million by 2010, local and regional planners were interested in balancing the environmental concerns of this fragile coastal region with economic needs.
The figure above depicts the change in urban growth between 1974 and 1994 using multispectral satellite imagery. Red indicates pre-1973 urban areas and yellow indicates urban growth after 1973. (Image courtesy of Sarah Weiland of the University of South Caroline Remote Sensing Laboratory and Richard Lacy of the South Carolina Department of Natural Resources.) In 1994, the National Aeronautics and Space Administration (NASA) Office of Mission to Planet Earth (MTPE), awarded a research grant (NAGW-4014) to the South Carolina Department of Natural Resources (SCDNR), the University of South Carolina, Georgia Tech Research Institute, and the Georgia Wildlife Federation (GWF) to use satellite imagery for studying the rate of development in the metropolitan Charleston area, South Carolina, and Savannah, Georgia. The goal of the study was to identify, document, and communicate the rate of urban change to support effective land planning decisions in the future. Choosing Imagery
The figure above is a Landsat Thematic Mapper image of Charleston acquired on February 1994. RGB equals bands 4,5,3. (Image courtesy of Steve Schill of the University of South Carolina Remote Sensing Laboratory.) Identifying Urban and Nonurban AreasUnsupervised classification techniques were used to derive land cover information from each of the images including a customized algorithm developed with ERDAS IMAGINE, which was used to more rigorously extract and label the fundamental urban and nonurban data. During the second phase of the project, the University of South Carolina's Remote Sensing Lab, under the direction of Dr. John R. Jensen, used subpixel processing and layered-classification techniques to achieve an even greater degree of accuracy by isolating the percentage of urban material within each pixel. Verifying AccuracyBecause in certain instances different types of land cover may have similar spectral signatures (e.g., sand beaches and concrete buildings), manual on-screen digitizing was performed in certain areas to improve the individual date classification maps. National Aerial Photography Program (NAPP) color infrared transparencies (1:40,000 scale) were used to verify differences between areas with similar spectral signatures. The BCDCOG examined 2,838 air photos from the tax assessor's office and soil and water conservation district offices from 1970 to 1994 to assess the accuracy of the image data. Urban classification errors of omission and commission from all image maps were individually digitized then converted to area-of-interest (AOI) files used by the SCDNR in the final urban/nonurban classification maps. The overall accuracy of the classification maps was determined to range from 95.3 percent to 97.3 percent and indicated a per-image error of no more than +/- 5 percent. Change DetectionWith approximately 90 percent accuracy in the final 12 classification maps confirmed, change detection was performed to identify urban growth in the coastal zone. Two dates were analyzed using a GIS (see sidebar entitled "Imagery in Urban Planning") matrix operation that cross-tabulated the land cover present at each pixel location in one date with the land cover present at the same pixel location in the other date. The change data confirmed that urban expansion in the region increased 255 percent over the two decades of the study (or 6.2 times faster than population growth, which occurred at 41 percent), increasing from 45,150 to 160,232 acres. While the persons per urban acre decreased 60 percent, the total urban acres per person increased 152 percent, emphasizing the land-consumptive nature of current development. Primary growth occurred in residential neighborhoods, near major transportation corridors, and along the prominent river systems in close proximity to fragile estuarine marshes. The urban core of the Charleston peninsula saw densification of buildings and the barrier islands expanded with developments such as resorts, golf courses, and beach-front homes. Using the Image Data
The figure above is comprised of six frames from a pseudo three-dimensional animated film that depicts a small portion of the Charleston study area. The six individual change detection maps were draped over a USGS 1:100,000 scale digital elevation model of the study area. (Image courtesy of Steve Schill of the University of South Carolina Remote Sensing Laboratory.) ConclusionThe project successfully produced the first multitemporal image database for use by local and regional planners in the area. "The information from this study is a harbinger of where we are headed," said Alfred Vang, deputy director of SCDNR's Land and Water Conservation Division. "Without proactive, community-based planning, the region's rich diversity of inland and marine systems will ultimately be lost. Studies such as this one enable local citizens to understand growth patterns in their communities." This project has spurred a State-wide plan for analyzing urban growth by the SCDNR, and the Strom Thurmond Institute at Clemson University is using the data in predictive modeling studies that are projecting growth trends for the next 35 years. And, finally, the BCDCOG is building on this project by developing a proposal funded under the Transportation and Community and System Preservation (TCSP) Program as part of the Transportation Equity Act for the 21st century (TEA-21) to link transportation and other infrastructure and land use planning. For more information, contact Dan Hatley at the BCDCOG (tel.: 843-529-0400, fax: 843-529-0305, e-mail: danh@awod.com). |
 "A real concern in this area is that the urban (developed) area is outpacing the population growth at a rate of 6 to 1," said Dan Hatley, planning services manager of the Berkeley, Charleston, and Dorchester Council of Governments (BCDCOG). "Consequently, the ratio of the development to the actual population growth is of most concern to planners in the region because of the impact on the environment and quality of life as well as fiscal impacts to extend infrastructure."
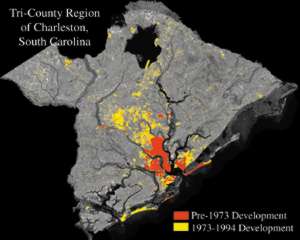 Because planners require timely, accurate, and reliable information to monitor urban change and manage land development, the first step was to select 12 dates of satellite imagery of the area over a 21-year period. Landsat Multispectral Scanner (MSS) data (80m x 80m resolution) from the 1970s was merged with Landsat Thematic Mapper (TM) data (30m x 30m) from the 1980s. The green, red, and near-infrared bands of the MSS and TM sensors, respectively, were chosen because they are very useful in discriminating vegetation from nonvegetation areas. Three classes of land cover were identified: water, nonurban, and urban.
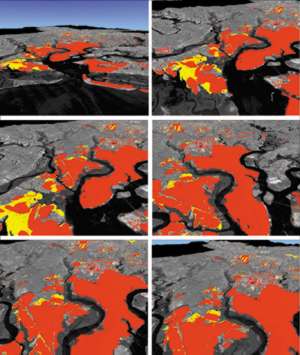 The final report and image maps were made available to the public on a CD-ROM. The BCDCOG incorporated the imagery and change data into its ArcView GIS database to assist local planners in identifying land use trends and developable land, and to create more accurate basemaps. All final products are available in a variety of formats ready for use by local planners in their ArcView GIS or ArcInfo (.IMG, TIFF World, Shapefiles, etc.) databases. The Berkeley County GIS Consortium (BCGIS) used the new classification maps to compare the accuracy of the data to traditional low-altitude aerial photos that county governments typically use for planning, mapping, zoning, and taxation purposes. Using ArcView GIS, the BCGIS compared aerial photographic imagery to the Landsat TM data. According to Greg Rines of the BCGIS, satellite imagery was most effective for analysis at the County level, while aerial photos provided a level of detail down to the block level.