Tracing ArcSDE Queries with SQL Profiler
by Shannon Shields and Joseph Buckles
Esri Education Services
Editor's note: SQL Profiler, one of the
performance monitoring tools that is included with Microsoft SQL
Server, can be used by the database administrator (DBA) to diagnose
problems and optimize performance. This article addresses how SQL
Profiler can be used with ArcSDE running SQL Server. A basic understanding
of both ArcSDE and SQL Server is assumed. A step-by-step tutorial
and a self-extracting archive containing sample data can be download.
By design, the communication that takes place between
ArcSDE Application Server or Direct Connect clients, such as ArcMap
and ArcCatalog, and SQL Server is largely transparent to the user.
Users will see very little difference between accessing a shapefile,
coverage, or personal geodatabase and an ArcSDE geodatabase. However,
when using ArcSDE data, very little of it is cached by the client
application so there is a constant stream of communication between
the client, where data is used, and SQL Server, where data is stored.
SQL Server contains many tools that can assist a DBA in viewing
and understanding the types of queries sent by ArcSDE clients.
This article will examine SQL Profiler, a SQL Server
tool, and its usefulness in evaluating database performance and
diagnosing errors. The DBA can create traces in SQL Profiler that
capture SQL statements. These statements can be used to evaluate
query performance, monitor server usage, and diagnose errors or
bottlenecks encountered by users.
What is SQL Profiler?
SQL Profiler allows system administrators to monitor
and record database and server activities. SQL Profiler provides
a graphical user interface to a series of stored procedures that
monitor server events. Various events are collected by SQL Profiler
and are returned to the administrator through the interface. Alternatively,
these events can be saved to a file or a SQL Server table. The administrator
can specify which server events to monitor and can further constrain
the events collected through the use of filters.
SQL Profiler can execute several different traces
simultaneously against local or remote SQL Servers. Saved traces
can be reexecuted or stepped through, event by event, to see where
problems occur or to test whether or not problems have been corrected.
SQL Server's Index Tuning Wizard can also use a saved trace file
as a workload.
SQL Profiler is a valuable tool for the ArcSDE
administrator. Traces that capture events specific to ArcSDE or
ArcSDE clients can be defined. Results returned from these traces
can help an administrator understand characteristics of system usage
such as which feature classes are accessed most frequently and what
are the most common types of queries executed by users. Understanding
how a system is used is the first step in establishing and realizing
performance-tuning goals.
 |
| Using SQL Profiler, an ArcSDE administrator
can capture events specific to ArcSDE or ArcSDE clients and
better understand system usage. |
Using the Profiler
In SQL Server 2000, traces are based on trace definitions
that can be stored in templates. A trace definition consists of
the events the DBA wishes to monitor, the data that will be collected
for each event, and any optional filters.
An event is an action generated within the SQL
Server engine. Individual events are grouped into categories. An
entire event category can be added to a trace definition, or just
individual events. Events include login connections, disconnections,
and failures; Transact-SQL (T-SQL) statements; the beginning and
completion of stored procedures; errors written to the SQL Server
error log; and locks acquired and released on database objects.
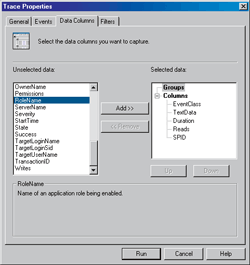
Data can be collected about each event. A list
of data columns makes up part of a trace definition. The data that
can be returned by an event varies between events and can include
the duration of the event, the CPU time allocated to that event,
the number of logical reads or writes generated by the event, the
application or user generating the event, and whether or not the
event executed successfully.
Even the most inactive instance of SQL Server can
generate a large amount of trace information. When an event is added
to a trace definition, every occurrence of that event is returned
by the trace. Filters can be applied to the event data to limit
the results of the trace to those events generated by a specific
user or application. Filters can also be set to look for specific
statements or specific database objects. Filters can also look for
events of a specified minimum or maximum duration.
Administrators can use the predefined templates
that come with SQL Profiler or create custom templates. Templates
can be created independently or as part of a new trace. Each trace
uses a template or begins with an empty list of events and data
columns. Trace and trace template properties can be modified except
when the trace is running.
Two Stored Procedures events, RPC:Completed and
SP:StmtCompleted, return the contents of ArcSDE stored procedures.
RPC:Completed occurs when a Remote Procedure Call (RPC) event has
completed. SP:StmtCompleted occurs when a statement within a stored
procedure has completed. The TextData data column for these events
displays the full text of the T-SQL statement. These events are
useful for observing and analyzing the queries passed by ArcSDE
clients.
SQL Profiler Scenarios
The following three scenarios, involving problems
commonly encountered by ArcSDE administrators, show how SQL Profiler
can be used.
Continued on page
2
|

