Crises Prove the Value of GIS
"Floods Kill Nearly 2,000 in China"
"Record Storm Surge Flooding From Hurricane Isabel"
 |
| The value of GIS was amply demonstrated during the wildfires in Southern California in October 2003. Santa Ana winds fanned several fires into major conflagrations that stretched from Ventura County to the border with Mexico. |
Headlines such as these reflect a harsh reality. Losses from natural disasters have shown a sevenfold real increase since the 1960s. By definition, disasters are large-scale events. Because tornadoes, fires, floods, and other catastrophes know no boundaries, responding to them typically requires joint activities by the agencies of the affected jurisdictions. These agencies must work together, coordinating resources, pooling information, sharing analyses, and communicating with the public and media.
GIS makes a common operational picture (COP) of any incident available to all participating agencies. Not only does GIS bring together data from many sources in an array of formats but it can also generate products—both paper and online—that support decision making and enhance communication.
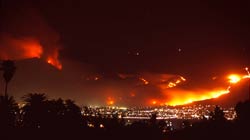
The value of GIS to emergency managers was amply demonstrated during the recent wildfires in Southern California. In October 2003, Santa Ana winds, gusting at 50 to 60 mph, fanned several fires into major conflagrations that consumed approximately 750,000 acres in an area that stretched from Ventura County to the border with Mexico. Satellite images showed dense gray smoke from the line of fires billowing across the state and into the Pacific Ocean.
At one point, an 18-mile wall of flames roared across portions of San Diego County giving area residents only minutes to flee. Fourteen county residents, who did not get out in time, perished in this fire.
 |
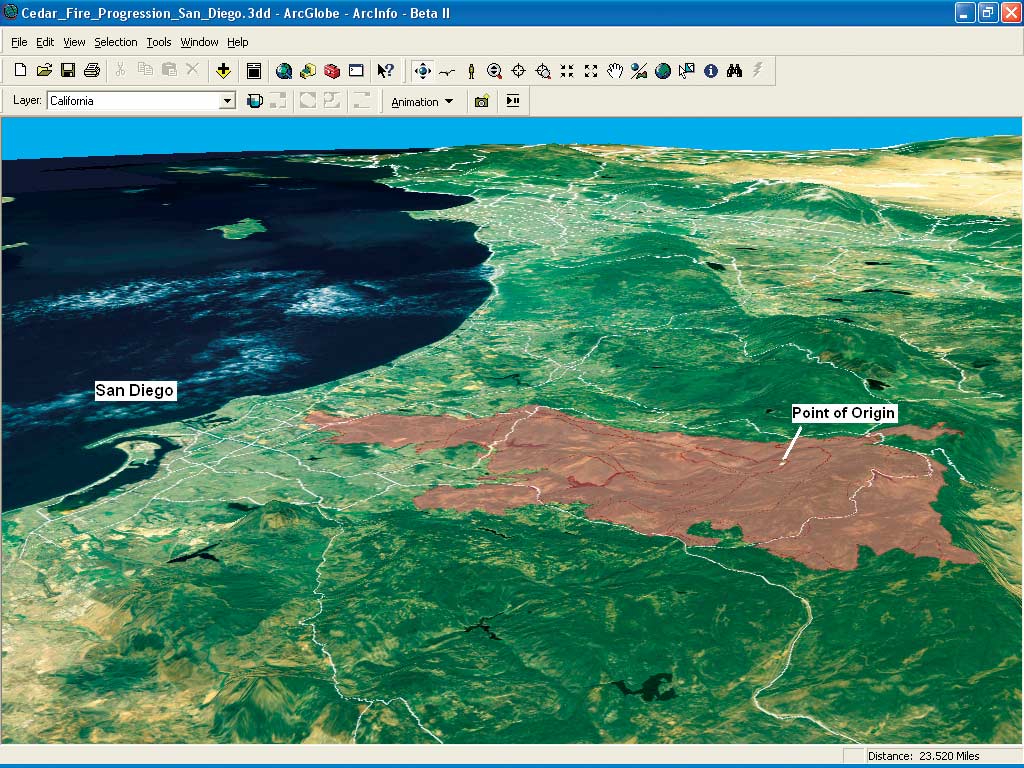
| Modeling the Cedar Fire illustrates the fire's spread from its point of origin. |
According to information supplied by the San Bernardino Fire Joint Information Center and the California Department of Forestry and Fire Protection, 22 people died and 4,814 structures were burned in the Southern California fires. In terms of damage and loss and cost to fight, it is one of the most expensive fires in the state's history. Even residents who did not lose homes and businesses were displaced. Some 95,000 people were evacuated from endangered areas. The losses to businesses and damaged infrastructure will be felt for years.
GIS was on the frontlines helping emergency personnel deal with the myriad tasks required in handling multiple incidents. GIS specialists, who work for the responding agencies, with assistance from Esri staff, toiled at the seven incident command posts and operations centers handling the fires to make maps, maps, and more maps in support of these fire fighting efforts.
Maps of the fire progression combined current fire perimeter GPS coordinate data with basemap data of elevation and transportation networks. Maps were needed for firefighter incident action plans and were necessary for firefighter field assignments such as establishing bulldozer lines for firebreaks and fire lines. Because the demands on fire fighting resources required cooperation from agencies outside the area and eventually from other states, current maps were especially critical for teams completely unfamiliar with the area, both from the standpoint of effectiveness and firefighter safety.
Incident commanders needed maps showing the values at risk and the transportation network. They needed facilities maps showing staging areas, helipots, drop points, and base camps and/or incident command posts. The mountainous terrain necessitated extensive use of aircraft, so maps showing air routes and air hazards were also needed. Maps also helped in meeting communications equipment needs.
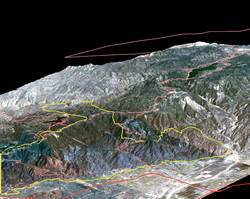 |
| Image and vector data were combined in ArcGlobe to show the extent and effect of the fire. |
Fire spread forecasting using FireView, a GIS-based product developed by Esri business partner The Omega Group, was used by incident commanders to anticipate demands in the coming hours and days and form contingency plans. Predicting fire spread also improved evacuation planning, and maps assisted the law enforcement agencies carrying out mandatory evacuation orders.
Printed maps and modeling were used extensively for briefing President George W. Bush, Governor Gray Davis, and Governor-elect Arnold Schwarzenegger and other top government officials as well as the public. Not only was the ArcGIS Spatial Analyst extension used but also the ArcGlobe application in the ArcGIS 3D Analyst extension, which will be released with ArcGIS 9. Online maps helped disseminate timely information to the public. Current data and maps were made available to journalists through MapShop, an ArcWeb Services Web application for creating customized maps that supply access to current and accurate data in output formats editable in typical illustration software.
As the fires were contained, damage assessment began. Firefighters quickly gathered data on the location and extent of burned areas and damaged structures using GPS-enabled handheld devices running ArcPad. This information was valuable in determining where evacuation orders could be lifted and in formulating plans for safe reentry into affected areas.
The far-reaching impacts of these fires are currently being evaluated using GIS. Public health officials are considering the effects of smoke exposure on children in this area. Currently, the county of San Bernardino's Flood Control Department, the U.S. Forest Service, Natural Resources Conservation Service, Bureau of Land Management, U.S. Fish and Wildlife Service, U.S. Geological Survey, and state and local agencies cooperating through the Burned Area Emergency Response (BAER) program, and the Emergency Watershed Protection Program of the U.S. Department of Agriculture Natural Resources Conservation Service are working on models that will anticipate subsequent problems caused by flooding and debris movement on denuded slopes. GIS analysis of the areas burned highlights another sobering aspect—although many acres burned, not many of those acres were in areas of high tree mortality. Dead trees remain as a ticking bomb, and mitigation efforts in these areas are continuing.
The high level of cooperation and swift execution of response efforts in San Bernardino and Riverside Counties were largely made possible through the exercise of foresight by groups in those counties. Eighteen months before the fires, government agencies, private companies, and volunteer organizations in both counties formed Mountain Area Safety Taskforce (MAST) organizations.
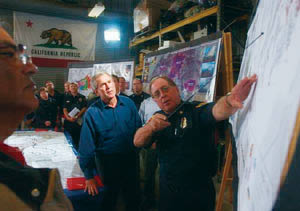 |
| A fire briefing was held for President George W. Bush at the Cedar Incident Base at Gillespie Airfield in El Cajon, California. |
These MAST organizations recognized the fire threat posed by high vegetation mortality in the San Bernardino and San Jacinto Mountains. They used GIS to assemble related data into one shared database. This data was used for modeling, analysis, resource management, and response planning. The CalMAST joint Web site, www.calmast.org, provides news, interactive maps, and other information about MAST efforts. The site was expanded during the fires to include a public information section containing maps for each fire and constantly updated fire, evacuation, road closure, and other related information.
While GIS continues to quietly improve the day-to-day lives of ordinary people in ways that go unnoticed by most, disaster response applications highlight the value of GIS. The unforgiving nature of these situations—the complexity of the problems, severe time restrictions, and high stakes—literally life and death—make a compelling argument for obtaining, analyzing, and sharing the most current and complete information. GIS helps provide that information and make it readily available to those whose life work is responding to disaster.
A new course from Esri Virtual Campus, Solving Disaster Management Problems Using ArcGIS, is designed for public sector and risk management professionals and others interested in applying GIS technology to disaster management activities. The six-module course explores how GIS technology is applied to tasks associated with the mitigation, response, and recovery phases of emergency management. Learn more about Esri Training and Education. For more information on how GIS is used in public safety, visit www.esri.com/publicsafety or contact Russ Johnson, Esri public safety industry manager, at 909-793-2853, ext. 1-1836.
|