ArcUser Online
More accurate and reliable crop estimates help reduce uncertainty in the grain industry. The South African Department of Agriculture Crop Estimates Committee was tasked with producing crop estimates for South Africa on a monthly basis. To perform this task, the committee receives data from various input suppliers. SiQ, a member of the National Crop Statistics Consortium (NCSC), uses statistical methods to provide inputs to the committee. Since 2002, crop information provided by producers has been used for statistical analysis. However, problems caused by producers who don't provide complete information, combined with a greater emphasis on improving statistical accuracy and efficiency, led to the development of an alternative system. The Producer Independent Crop Estimate System (PICES) was developed in 2005. Implemented after a successful pilot study conducted in the Gauteng province, PICES uses crop field boundaries digitized from satellite imagery with a point frame sampling system to objectively estimate the area planted with grain crops. The PICES process consists of the following steps:
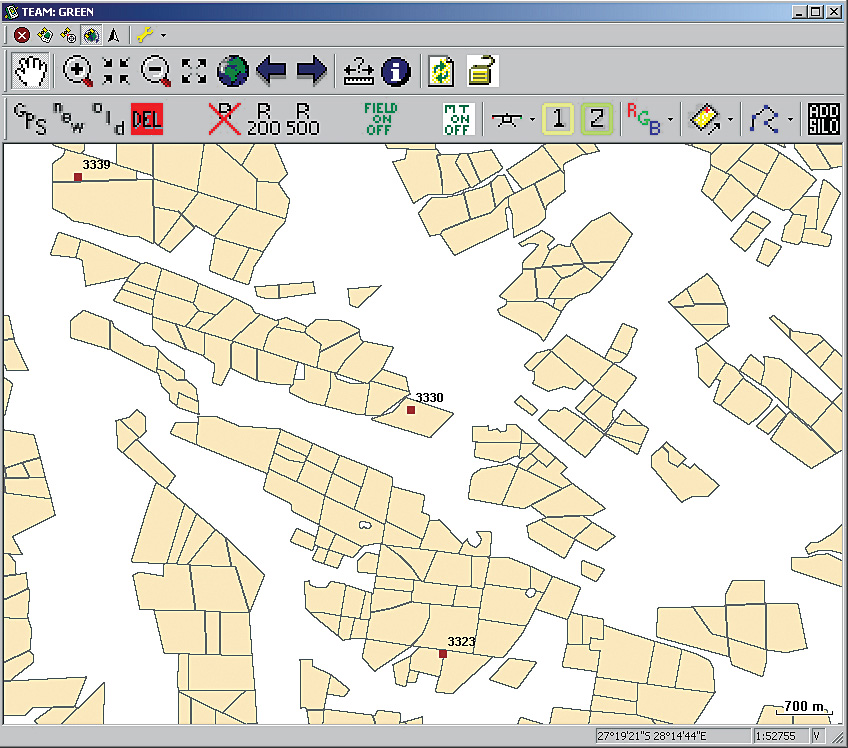
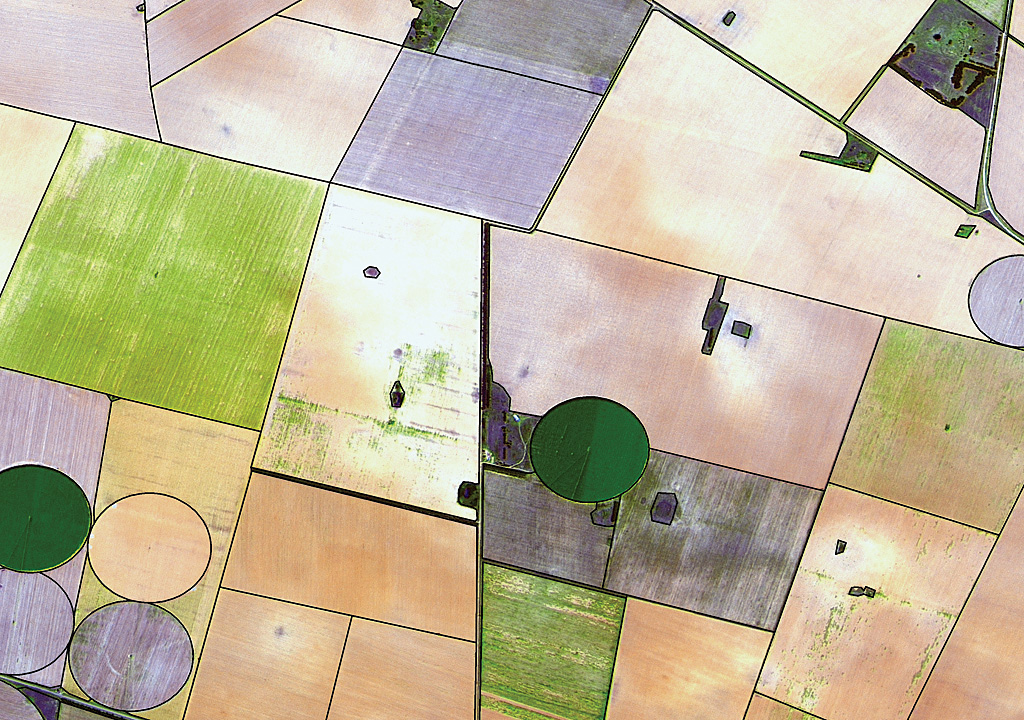
Obtaining Satellite ImagerySatellite imagery for the project is made available by the South African government through the Department of Agriculture. SPOT Image Spot 5 satellite imagery with a 2.5-meter resolution is obtained from the department and is used as the base layer for digitizing. Digitizing Crop Field Boundaries from the Satellite ImageryThis is done in ArcMap at a scale of 1:10,000. Comprehensive quality control measures are part of the digitizing process to ensure clean, accurate data of high quality. Detailed metadata is captured in ArcCatalog as soon as the dataset for a province has been finalized. This metadata is updated whenever changes are made to the dataset. All nine provinces of South Africa have been digitized—a total of approximately 12,965,000 hectares. The updating schedule and procedures ensure that the dataset remains current. Designing the Point Frame and Selecting Random Sample PointsIn the next step, sample points are randomly selected to represent potential cropped fields. These points will be surveyed in the field. A point grid of 45 meters by 45 meters is set up for the total provincial area. Grid points located outside field boundaries are removed from the sample population because these points are unlikely to locate crops.
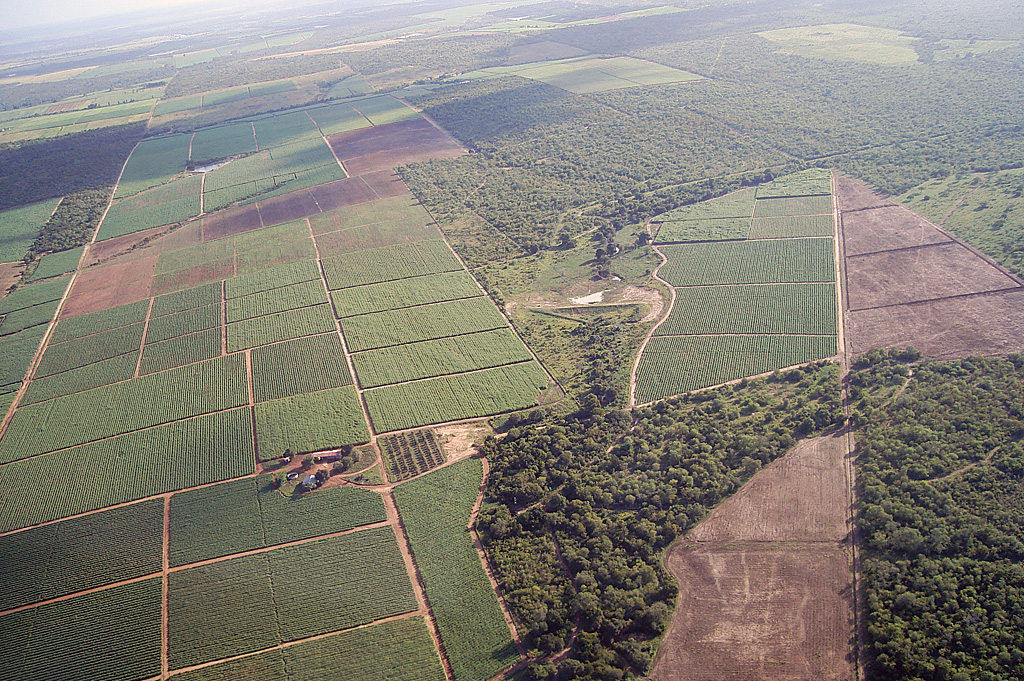
Digitized fields are stratified based on the probability of finding a crop. The core strata used are high, medium, and low cultivation. High, medium, and low refer to the densities of fields within any given area as well as the presence of pivot irrigation and small-scale farming. Stratification is done to increase sampling efficiency. More sample points are used in strata where there is a higher likelihood of finding crops of interest. This will obtain the most useful data within budget constraints and keep the Coefficient of Variance (CV) as low as possible. [CV is the ratio of standard deviation to the mean; it is used when comparing datasets with different units or widely differing means.] The grid points are selected per stratum and exported to a Microsoft SQL Server database. These points are sorted systematically from west to east and north to south. This is done to ensure an optimal geographic distribution of sample points. A random starting point is chosen and points selected at regular intervals according to the number of points needed in the specific stratum. The selected points are inserted into a new table in the database, and the process is repeated for each stratum. Finally, the SQL Server tables are added in ArcMap and converted to shapefiles containing the sample points for each stratum. Aerial Surveying of Sample Points to Capture Crop DataAn aerial survey of the sample points is conducted. This aerial survey determines which crop is planted in the field represented by each sample point. These surveys are conducted by a field observation team that consists of a pilot and an observer in a very light aircraft. The observer is from the agricultural community and is very experienced at distinguishing between different crops and differentiating between dry land and irrigated cultivation. Typically, the number of sample points verified for each survey requires the use of more than one field observation team. This system of capturing field information for crop estimate purposes is believed to be unique in the world.
A Tablet PC connected to a GPS and running ArcPad is used to capture this data. ArcPad is customized with a user-friendly interface. The field observer notes which crop is planted at the sample point and whether it is dry land or irrigated cultivation. Additional information, such as growth problems or areas of double-cropping, is also captured. In addition to the data that is being captured, the observer also takes photos to provide more information on the conditions in the field during the specific survey. Each photo taken is automatically linked to a shapefile that indicates where it was taken. Performing Statistical AnalysisThe field data is captured and stored in shapefile format. This data is uploaded to a central server on a daily basis and imported into a SQL Server database. Expansion statistics are used to calculate estimates of the area planted in each grain crop on a provincial basis. ConclusionThe need to objectively estimate area planted under grain crops prompted the development of PICES. The system uses crop field boundaries digitized from satellite imagery together with a point frame sampling methodology and aerial field surveys to objectively estimate the area planted for each grain crop. PICES has proved to be extremely cost effective when compared with the previous system that used information gathered from producers. An area of approximately 12 million hectares can be covered in a two-month period using three field observation teams. The accuracy has also been improved by 40 percent per province. The use of GIS has greatly improved crop estimates in South Africa and resulted in more cost-effective, accurate, and objective grain area estimates. For more information, contact Annalie Fourie, SiQ, at +27-12-349-0050 or annalie.fourie@siq.co.za. About the AuthorAnnalie Fourie is a GIS specialist for SiQ. She obtained her honours degree in GIS from the University of Pretoria, South Africa. She obtained her bachelor's degree in town and regional planning from the same university. Since 1999, she has been involved in diverse GIS projects. Esri offers a free Web course, Introduction to ArcGIS 9 Geostatistical Analyst, and a free training seminar, Understanding Spatial Statistics in ArcGIS 9. |