ArcUser Online
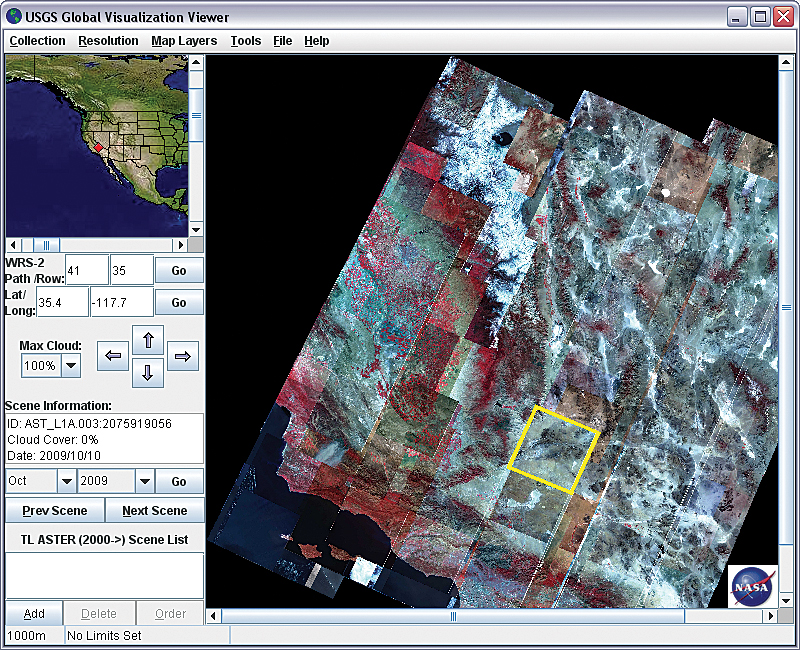
It has been challenging to easily obtain and georeference a sequence of aerial photographs or satellite images of the same area of the Earth's surface to detect changes. A relatively new resource, TerraLook (terralook.cr.usgs.gov), has made that process much easier. This U.S. Geological Survey Web site provides recent and historical satellite data as georeferenced JPEG images at no charge. The source data is the global land datasets using Landsat data (from the 1970s and circa 1990 and 2000) and the full Advanced Spaceborne Thermal Emission and Reflection Radiometer (ASTER) archive (2000 to 2008). Note that TerraLook does not make the full multiband ASTER datasets available for free—just the georeferenced images derived from them. Still, it is a tremendous resource for both research and instruction. The datasets are provided as simulated natural color images. TerraLook's goal is to serve data users who need images of the Earth but may not have technical remote-sensing expertise or software. TerraLook collections are one to hundreds of satellite images from a single region or many regions of the globe chosen by users of the site from the Landsat or ASTER images available. Images are selected using the Global Visualization Viewer (GloVis) available from the TerraLook site. With GloVis, specific image types can be selected for particular areas of the planet via a mapping interface. When an order is ready, an e-mail message is sent to the user that contains instructions and a link for downloading the ZIP file that contains the images and metadata. One of the best things about TerraLook is that image collections of many countries and some areas have already been created and can be downloaded directly from the site. The ZIP files for these image collections can be very large but can still be downloaded with a broadband connection. Images from TerraLook can be easily brought into ArcMap or the free TerraLook software available at terralook.sourceforge.net. The images come with a vector file containing the satellite "footprints" of all the images downloaded. The site is being translated into several languages. Because images from the different years have varying pixel sizes, comparing the images in the TerraLook software is an excellent starting point for a discussion about scale and spatial resolution. The Landsat Multispectral scanner (MSS) images from the 1970s on the site are composed of pixels that are 57 square meters in size, while Landsat Thematic Mapper (TM) and Enhanced Thematic Mapper (ETM+) images on the site have pixels that are 28.5 square meters. The ASTER pixels are 15 square meters. The areal coverage also varies: the ASTER images, at 60 by 60 kilometers, cover about one-ninth the area of Landsat images, which are 185 by 170 kilometers. Consequently, urban areas, reservoirs, and other features will look different not only because images were taken at different times but also because of the resolution of the images. What sorts of changes will you be able to detect from the TerraLook collections? You should be able to see evidence of large-scale changes such as those from the eruption of Mount St. Helens, the drying up of Lake Chad and the Aral Sea, evidence of fires at Yellowstone National Park and elsewhere, and changes to topography caused by flooding rivers and glacial retreat. I also encourage you to look for less dramatic but equally interesting changes. Some of these changes could be seasonal, such as vegetation response to South Asia's monsoons, the advance of the growing season each spring, and the differences in the seasonal cycle between the Northern and Southern hemispheres. Other changes reflect human impact on the planet, from urban sprawl to the construction of dams and airports to the expansion and contraction of agriculture depending on local conditions and population pressures. From TerraLook, I downloaded a series of images for Phoenix, Arizona, and loaded four of them into ArcMap. In the resulting layout (shown in the figure above), it is possible to detect changes in this rapidly urbanizing environment. Approximately 5 percent of Maricopa County, the county that includes Phoenix, is under the control of five Indian Nations. Land belonging to three of these nations—the Gila River Reservation to the south and the Salt River Pima-Maricopa and Fort McDowell Mohave-Apache communities to the northeast—border the urbanized area. In 1975, the Salt River boundary was clearly evident on the satellite image. By 2000, negotiations between the Salt River Nation and the State of Arizona had resulted in a freeway and adjacent development. By 2004, this had reduced the extent of irrigated fields in that area. Freeway development is controversial in Phoenix and elsewhere. You can have your students investigate the ongoing South Mountain Freeway debate, using these images as a starting point. I encourage you to make use of these images from TerraLook in your own research and instruction. |