ArcUser Online
|
:
|
There is an inherently spatial component to many aspects of crime analysis. Incorporating GIS into these activities provides a significant analytical tool. Presenting pattern detection and conducting time series and correlating analysis as quantifiable events increases the value of criminal justice records. Combining GIS with traditional methods of data analysis, intelligence gathering, and resource allocation allows law enforcement professionals to use GIS as a decision support tool and further understand relationships between crime events and geographical areas. Jefferson County is developing the Crime Analysis Program and Event Reporting (CAPERS) to take a proactive role in effectively policing the most populous county in the State of Colorado. Jefferson County, the largest county in Colorado, has a population of approximately one-half million people. The Sheriff's Department is primarily responsible for the unincorporated part of the County but also has duties within the municipalities. The unincorporated portion contains both urban areas within the greater Denver suburban areas as well as growing mountain communities. The Sheriff's Department logs approximately 35,000 events a year, spread out over 780 square miles. Like many other counties, Jefferson County has spent years building and collecting data. The GIS Department has built coverages of roads, addresses, land use, zoning, parks, neighborhoods, sheriff beats, and parcels. In 1993, the MIS Department designed and built the Records Management System (RMS) using IBM DB2 on an IBM AS400 to keep track of crimes and events for the Jefferson County Sheriff's Department (JCSD). An event is defined as any incident initiated by the Computer-Aided Dispatch (CAD) system in which an officer was dispatched. Officers respond to many that may or may not result in the issuance of a case report. While the RMS system tracks the individual events and officers' reports, it was necessary to link RMS to a GIS to utilize the spatial information component inherent in criminal activity. Design and Budget Issues Though numerous designs were considered in developing CAPERS, a graphical user interface (GUI) was adopted early in the planning phase because of its ease of use, familiarity for users already in a Windows environment, and the ability to simplify GIS concepts. The County was still using a 16-bit operating system on the desktop that precluded using a Windows NT solution. The existing IBM AS400, which was a mission-critical box, was already burdened and additional processing load would have adversely affected existing systems. Consequently, it was stipulated that the proposed system could not affect the existing system's performance. The CAD system, RMS, Detention Management System, and other smaller subsystems are currently operating on this IBM AS400. Since GIS data extractions and selections are large, the only way to avoid impacting the IBM AS400's performance was to replicate the database or some subset of it on another machine. Appropriate security measures were necessary to satisfy statutory requirements for the protection of the data and the comfort level of the data processing and records staff of the Sheriff's Department. The Sheriff's Department considered the IBM AS400 a secure machine, did not wish to compromise that security, and needed to be confident that any additional hardware platforms would provide a similar level of security. The addition of a second, smaller IBM AS400 was rejected because the County's GIS software would not run on it. A UNIX server was ultimately chosen for its scalability and ability to run GIS software. Additional processing, RAM, and software licenses can be added to accommodate additional system users. The size and security needs required a robust relational database, and platform limitations made UNIX the most suitable operating system. Using this approach, the client supports GUI and local GIS functions while operations that require processing large amounts of data are done on the server side. The selected database had to be Open Database Connectivity (ODBC) compliant, support standard SQL, and be able to handle large and growing database applications. Nonstandard file formats had to be compatible with the relational database. Informix OnLine 7.22 was chosen for its ability to perform these tasks and because the staff had experience with similar products. Significant resources may be necessary to develop a system capable of meeting users' goals. Approximately $208,000 was allocated for the project for hardware, software, and training. Programming labor costs were not included in the budget and were provided by the GIS Departments applications section, as were the needs analysis and design. The system configuration was determined to meet the overall present needs for the project. System Configuration
Spatially Enabling Legacy Databases Many legacy databases were designed for a specific purpose and lack any spatial component. A key task was to find common fields that could be used to join or relate tabular data to spatial data sets. Close scrutiny of legacy data sets will often reveal errors. Moving data from these legacy systems to a GIS compliant data structure provides an opportune moment to cleanse these databases. Jefferson County has been using Common Address Matching System (CAMS), an in-house program, as a standard for all applications developed within the county. CAMS utilizes a serial field called ADNO (short for address number) as the primary key which creates a unique integer which increments by one for each new event. Although ADNO existed within RMS, field definitions differed from the CAMS standard. RMS had to be redefined to make it comply with the CAMS standard. Initial plans were to use the ADNO field to link the spatial data to the RMS event data. However, addresses exist only as a social construct and are not a coordinate system. Relying solely on addresses instead of coordinates creates a new set of challenges, so it was decided to alter CAMS by adding x and y fields to that would contain State Plane coordinates. CAMS had previously been processing address data through geocode matching. The data in RMS was matched against CAMS and the resultant x,y values were uploaded to the events table in the Informix database.
By moving from a strictly addressed-based system, non-addressed events such as occurrences at intersections, within open space, or in large tracts or parcels could now be captured and recorded. Although global positioning system (GPS) capabilities are not currently used by the Sheriff's Department, CAPERS design will facilitate the inclusion of this data when it is implemented in the near future. RMS was initially designed as a transactional database. Multiple tables had to be updated before a transaction was committed. This system was designed for efficient data on a system with many concurrent users. The events table was organized in a last in first out (LIFO) structure in order to have quick access to any changes made to a record. Every time an item changed, a new record was generated. Since the table was sorted by event number and update date, it was easy to step backwards through the changes. This system was not the most conducive design for the efficient extraction of data. CAPERS needed to retrieve data as quickly as possible to overcome sluggish dynamic data exchange (DDE) and ODBC connections. SQL statements, using sorts and distincts, designed to retrieve only the most current record for each event, were tested. Performance was unacceptable so it was necessary to have the Informix event table contain only the most current record for each event. Performance timing and SQL optimizers were implemented to improve performance. Indexing and permanently joining tables becomes more crucial when converting from such highly normalized database structures. The RMS database used numeric codes for identifying crime types. Since the GIS systems were designed for end users, joining these codes with their descriptions seemed appropriate. Other issues that surrounded the conversion of the legacy system required changing conventional practices of data collection and structure. Implementing GIS led to improved queries on the precinct level. Precincts are numbered. When the Sheriff's Department previously changed the precinct boundaries, the same set of numbers was used for the new areas which significantly affected reports and data input. Queries of the legacy system for all events within a precinct caused some of the events that had occurred in the precinct to fall outside the current definition of the precinct and reports summarizing data by precinct and beat to include events that occurred nowhere near that precinct. To fix this problem, the GIS Department supplied a list of CAMS ADNOs (unique address numbers) and the precinct in which they were located. The MIS Department ran the RMS database against this list to correct the precinct number. Although this change had been affecting the statistics being generated, no one had noticed it until the events were displayed spatially. The reasons for this problem were apparent to the GIS staff but lengthy explanations of the problem had to be made to departments accustomed to using this data in tabular form. Data Transfer and Connectivity How does one integrate all these disparate systems? It is sometimes erroneously assumed that this is no more difficult than a Windows drag-and-drop operation. In reality, some components will never effectively communicate with the available tools. Many products designed to transfer data between the IBM AS400 and UNIX platforms were prohibitively expensive. Some were eliminated because they required Windows NT, which had not been adopted as a County standard.
Other methods had to be used to integrate other components. ArcView GIS did not support OLE so DDE was used to transfer information between the Visual Basic GUI and ArcView GIS. Overall, this worked well but development was hampered by the lack of error-trapping information between the packages. Though cliche, a picture truly is worth a thousand words for the crime analyst. Some relationships are best identified through visually presenting the information and allowing analysts and investigators to infer results. This is easily demonstrated by the ubiquitous crime tack map. GIS allows the use of other methods to quantify the spatial relationships in addition to intuitive processes. A list of user specifications for CAPERS follows.
Traditional methods included the creation of frequency tables that break down events by type. Date values are set using visual calendar tool that can then be used in selecting events and comparing frequencies. Time series analysis is conducted by comparing occurrences of events between two discrete time periods. This was accomplished by creating stored procedures in the Informix database. Conclusion The first phase of CAPERS gives the department a place to begin using GIS for analysis and investigations. The project was completed within target time lines and the allotted budget. As the County's law enforcement professional use of geographic data becomes more sophisticated, additional functionality will be necessary. More complex analysis and statistics will be needed such as linear spline regressions for pattern description, spatial-temporal cluster analysis, and other tools for predictive modeling of crime. It is likely that the entire project will be ported to a Windows NT environment when it is adopted as the County's standard platform. The adoption of Windows NT will expand the possible hardware and software solutions available to JCSD to include the use of specialized report writers, MapObjects, or other ActiveX components. Additionally, data transfer tools and techniques may permit a more streamlined approach to the transfer of the legacy systems data sets. Numerous tools exist currently--and their numbers and utility can reasonably be expected to increase--for applications development. The GIS developer can capitalize on these to create more customized interfaces and functionality to present complex data topics and GIS concepts to mainstream users. For more information, please contact Stuart M. Schwartz by E-mail at sschwart@co.jefferson.co.us or by phone at 303-271-8798. Jefferson County GIS Department100 Jefferson County Parkway Jefferson County, Colorado 80401 Selected Bibliography Bratt, Robert K., Joseph R. Lake, Jr., Theresa Whistler. Implementation of GIS at Local Law Enforcement Agencies.1994.Groff, Elizabeth. Geographic Information Systems for Community Policing: A Micro-Analysis of Crime. Proceeding of the 35th Annual URISA Conference. 1997. Maltz, Michael D., Andrew C. Gordon, and Warren Friedman. Mapping Crime in Its Community Setting: Event Geography Analysis.Springer-Verlag. 1989. About the Authors Sherry Boboricken, the GIS project manager for Jefferson County, has masters degrees in geography from the University of California at Berkeley and in computer information systems from the University of Denver. She is particularly interested in providing GIS applications to decision makers, and her most recent project is an incorporation model to help estimate expenses and revenues. |
 If ADNO was used, a query would have to be sent to ArcInfo to buffer all events within the desired proximity, then
a separate query sent to the RDBMS to retrieve attribute data for the events. Querying by coordinates means ArcInfo
no longer had to be used as a "clip engine" to isolate events of interest. Using the additional X and Y fields for CAMS
reduced the load on the network and reduced processing time as an ODBC connection to the Informix database could be
made and an event selected by coordinate values through SQL statements. Proximity searches could be made by including
simple mathematical expressions within these SQL statements.
If ADNO was used, a query would have to be sent to ArcInfo to buffer all events within the desired proximity, then
a separate query sent to the RDBMS to retrieve attribute data for the events. Querying by coordinates means ArcInfo
no longer had to be used as a "clip engine" to isolate events of interest. Using the additional X and Y fields for CAMS
reduced the load on the network and reduced processing time as an ODBC connection to the Informix database could be
made and an event selected by coordinate values through SQL statements. Proximity searches could be made by including
simple mathematical expressions within these SQL statements.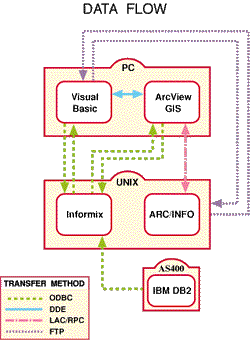 The solution was less than elegant. Preprocessing had to occur on the IBM AS400 to delimit and massage fields. RMS
did not include time and dates as defined data types. It was decided that CAPERS would benefit from using these data
types for time series analysis. Preprocessing had to occur at off-peak hours�a difficult proposition for a seven days a
week, twenty-four hours per day operation. Data was then transferred via an FTP connection to the UNIX server.
The solution was less than elegant. Preprocessing had to occur on the IBM AS400 to delimit and massage fields. RMS
did not include time and dates as defined data types. It was decided that CAPERS would benefit from using these data
types for time series analysis. Preprocessing had to occur at off-peak hours�a difficult proposition for a seven days a
week, twenty-four hours per day operation. Data was then transferred via an FTP connection to the UNIX server.