ArcUser Online

|
:
|
Reinsurance is insurance for insurers. Direct insurers purchase reinsurance to protect themselves against large accumulations of losses that would otherwise severely affect their balance sheets. Set up after Hurricane Andrew devastated southern Florida in 1992 and rocked the insurance world, Partner Reinsurance Company Ltd. (PartnerRe) originally specialized in reinsurance for similar catastrophes. Since then the company has grown significantly both in terms of infrastructure and in lines of business covered but strongly committed to reinsurance for catastrophes. To accurately price reinsurance for catastrophes, reinsurers have increasingly made use of pure research from widely disparate fields. Since the immediate relevance of a significant proportion of academic research is often low, in-house expertise is needed to translate basic science into quantitative models for pricing business. At PartnerRe, a multidisciplinary team of geophysicists, meteorologists, and engineers provides this expertise. Modeling RiskArcView GIS and ArcView Spatial Analyst provide an effective tool for reinsurance researchers. The combination of analysis functions accessible through the use of grids in ArcView Spatial Analyst and the ability to customize ArcView GIS through the use of Avenue has enabled the PartnerRe research team to carry out both data analysis and modeling in the same environment. By performing all these tasks in one environment, the same person can choose a modeling methodology and implement its algorithms without having to call on the expertise of a specialist programmer. Though the saving in time realized by this approach is modest initially, it rapidly increases as expertise with Avenue grows. The program's flexibility allows the user to alter the algorithms dozens of times before finally deciding on an ideal methodology--a priceless benefit.
The PartnerRe hurricane model illustrates this approach. The model provides underwriters with risk prices for hurricanes occurring in the United States. In a reinsurance company, underwriters are responsible for assessing whether to give a primary insurer coverage for the risks or "book of business" he wants to reinsure. Underwriters then calculate how much premium the primary insurer should pay for that coverage. The risks are submitted as county or ZIP Code totals and are broken down into various business types such as automobile, mobile home, household, and commercial. To price this coverage, a typical model would overlay all historical hurricanes on the client's book and calculate an expected loss for each hurricane. The resulting list of losses would then be turned into a loss curve so the reinsurer can estimate the frequency of claims and thus how much to charge for the policy. The model always consists of two parts. The hazard section deals with the intensity, frequency, and location of the natural phenomenon causing damage. The vulnerability section quantifies the response of the insured properties to a given hazard intensity. Most recent hurricane hazard modeling within the insurance industry follows a methodology outlined in the National Weather Service publication entitled Hurricane Climatology of the Atlantic and Gulf Coasts of the United States (NWS38) or a modified NWS38 methodology. NWS38 was produced by National Oceanic and Atmospheric Administration (NOAA) scientists in 1987. This methodology predates Hurricane Andrew, which was the most costly hurricane to date in terms of absolute dollar amount of damage.
Improved Methodologies Using ArcView GIS, basic hurricane data sets were easily visualized, and Avenue was used to implement models for data interpolation that took into account different rates of change of hurricane characteristics over land compared to over water. Hurricane wind fields were simulated in ArcView Spatial Analyst and modified using other grid data sets such as digital elevation model (DEM) data sets. The basic methodologies used were derived from the most current scientific research in the field and checked against ground truth in the form of meteorological measurements. Doerte Aller, the PartnerRe research team meteorologist, was impressed by the ease with which data could be visually checked. It was very easy to see where the model failed, and often even possible to work out why it failed.Once the base data was analyzed and well characterized, exploratory models were developed to simulate hurricane development and movement. Dozens of different approaches were tried before selecting a methodology that best fit the base data and produced realistic hurricane behavior. A full pricing model requires the calculation of losses for each simulated storm as well as for historical storms. These losses must be estimated rapidly and accurately for any client's book of business. Insurers in the United States are familiar with modeling and provide data in standard formats at different ZIP Code aggregations. The challenge is to quantify losses generated by a particular hurricane wind field as its force is modified by topography, urban roughness, and other factors and determine how it would affect the given portfolio. Using engineering expertise and multivariate statistical analysis, the relative importance of factors, such as type of shelter modifying the degree of hazard or construction type affecting the vulnerability of insured buildings, can be quantified. The aim is to identify the most effective compromise between model detail and reliability. Desktop Access to Answers In the final step, a user interface was developed so underwriters could rapidly price business as it is submitted on CD-ROM, floppy disk, or by E-mail. ArcView GIS combined with Dialog Designer was an ideal environment to develop a modeling tool that underwriters could use on their desktops. The primary reason for this approach was the flexibility provided. Constant Change Requires Flexibility One of the most enduring aspects of reinsurance modeling over the last few years has been the pace of change. Aspects of all models rapidly become obsolete. Since the model is actually a set of Avenue scripts and data sets, it is inherently modular. New algorithms and data can be incorporated with relative ease. ArcView GIS and ArcView Spatial Analyst provide a desktop GIS capable of more than just data visualization and analysis. In cases where entirely new modeling algorithms need to be developed, customization using Avenue scripts allows meteorologists, geoscientists, and engineers to implement and evaluate a significant number of possible methodologies before selecting the best. ArcView GIS Dialog Designer empower these scientists to deliver enduser applications based on the newly developed methodologies. As a result, PartnerRe is now even better equipped to help its clients find a tailored reinsurance solution at a fair price. For more information about GIS-based reinsurance pricing models, please contact Dr. Rick Thomas at PartnerRe Services in Zurich by E-mail at thomas@partnerre.com or by phone at 41 (0)1 224 3535. About the Author After completing a degree in natural sciences at Cambridge University England and a Ph.D. studying and modeling volcanic eruptions at Bristol University, Rick Thomas worked for two years on a European Economic Community (EEC) postdoctoral fellowship studying volcanic risk in Europe. In 1994, he became involved in the insurance industry and joined CARtograph. As development manager for CARtograph, Thomas used GIS extensively to model natural perils initially within the United Kingdom and then globally. In 1997, he joined PartnerRe's research team and works on various modeling projects. |
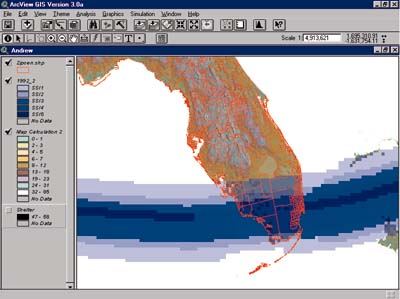 An Example: Hurricane Models
 The methodology, based only on land-falling hurricanes, seeks to quantify the frequency
and direction of landfall for coastal segments of the United States. This methodology
fails to deal with hurricanes that make multiple landfalls in different territorie--a
significant flaw. Such hurricanes are potentially ruinous for reinsurers so a new hazard
methodology was required. A method that simulated the entire life cycle of a hurricane was
envisaged as an ideal objective, but developing such a methodology was risky and required
groundbreaking work.
The methodology, based only on land-falling hurricanes, seeks to quantify the frequency
and direction of landfall for coastal segments of the United States. This methodology
fails to deal with hurricanes that make multiple landfalls in different territorie--a
significant flaw. Such hurricanes are potentially ruinous for reinsurers so a new hazard
methodology was required. A method that simulated the entire life cycle of a hurricane was
envisaged as an ideal objective, but developing such a methodology was risky and required
groundbreaking work.