ArcUser Online

|
:
|
Arguably the most powerful weapon in law enforcement is information technology. Law enforcement has always been about information management and especially about location information. Traditional law enforcement approaches--confidential informants, street investigations, undercover operations--really deal with data collection. However, data collection without data analysis is useless. Not only does GIS allow integration and analysis of data to identify, apprehend, and prosecute suspects, it aids more proactive behavior through effective allocation of resources and better policy setting. Precinct boundaries, beats, and incident locations are all tied to geography. From pin maps to beat maps, mapping has always been part of law enforcement. GIS is just a logical extension of the types of things that law enforcement agencies have always done. Now these tasks can be accomplished in a more timely fashion. Though computer mapping has been used as a tool for law enforcement since the 1970s, the use of GIS has increased exponentially in the last three years with the availability of more robust and user-friendly desktop GIS applications. The ability of GIS to query over political boundaries improves utilization of databases and is far more efficient than paper document-based searches or straight database searches. Briefly put, GIS lets agencies utilize more information more intelligently. The adoption of information technology and GIS specifically has been encouraged on the federal level by the National Institute of Justice (NIJ), the research arm of the United States Department of Justice that funds research to develop programs that reduce or prevent crime. Esri is working with NIJ and three law enforcement agencies in California--the Salinas Police Department, the San Bernardino County Sheriff's Department, and the Los Angeles Police Department Crime Analysis Unit--to develop crime analysis tools.A wide variety of crime analysis tasks benefit from the use of GIS. These tasks range from identifying gang territories and integrating image and scanned documents with database information to generating a list of suspects based on proximity to an incident location. By linking information in several databases to an incident location, officers can obtain the history of incidents at an address. Access to this breadth of information promotes development of strategies for dealing with ongoing situations and aids in completing investigations. 
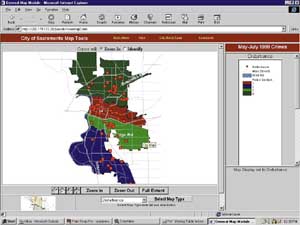
GIS not only helps analyze crime trends but can also be used as a tool to more effectively manage agency resources. Balancing workloads by drawing up more equitable beats and evaluating the results of selective traffic enforcement plans are just two ways GIS helps coordinate feedback and allocate resources. Another development that has promoted the use of GIS in law enforcement is the Violent Crime Control and Law Enforcement Act of 1994. This act, the largest crime bill in United States history, provides for 100,000 new police officers and awards grants to agencies that establish community policing programs. Community policing emphasizes cooperation and information sharing between law enforcement agencies and community residents. Officers can use GIS-based applications not only to better understand the demographic characteristics of their neighborhoods but also to learn what has happened on their beat since they were last on duty. Internet Map Server technology from Esri allows agencies to easily access information which is as current as the database and give residents up-to-date information via the Internet. In addition to the emphasis on community policing, laws such as Megan's Law, which requires local law enforcement agencies to notify residents about the presence of certain sex offenders in their area, mean that departments must be able to identify and contact citizens based on their location. GIS provides a way to quickly identify the residents or entities that must be contacted and can be used to coordinate mailings to them. A broad range of solutions are now available to law enforcement agencies from desktop applications that operate virtually out of the box to highly customized applications built using MapObjects in standard development environments such as Visual Basic or C++. Because Esri software works together and use standardized file formats, solutions for law enforcement can be both flexible and scalable. Desktop GIS packages tailored to meet the needs of law enforcement agencies have made GIS a viable tool for small departments. CrimeView is an example of this type of solution. Developed by The Omega Group, an Esri business partner, Crime View is a crime reporting, mapping, and analysis extension to ArcView GIS that includes incident and known offender reporting by standard and user-defined geographies, crime density and repeat call investigations, and custom report and map creation. At the other end of the spectrum, more sophisticated applications, such as those developed by the Philadelphia Crime Analysis and Mapping Unit, can model incidents over time through a combination of animation and GIS showing the clustering of crime incidents both temporally and spatially. This unit, which began operations in 1997, has also recently developed customized applications for stolen vehicle tracking and burglary modeling as well as more standard crime analysis tools. The unit benefited greatly from both an existing well-developed enterprisewide GIS in the City of Philadelphia and from a technology block grant from the NIJ. This issue features stories that describe how law enforcement agencies are using GIS to promote community policing and effectively analyze crime data. The Crime Analysis Program and Event Reporting System (CAPERS) is being developed by the Jefferson County Sheriff's Department in Colorado as a decision-support tool that will let the department take a more proactive role in policing by understanding the relationship between crime events and geography. The department had to deal with security issues and overcome the challenges of a heterogeneous computing environment when implementing CAPERS. Another article describes the results of a study of spatial statistical methods for generating maps modeling crime event density that was funded by a grant from the NIJ and used data from the New York City Police Department's On-Line Compliant System. For further information on using GIS for law enforcement and criminal justice, contact Lew Nelson at lnelson@esri.com or 909-793-2853, ext. 1690. |