ArcUser Online
Since the initial outbreak in New York City in 1999, the geographic range for West Nile virus (WNV) in the United States has been rapidly increasing. The total number of human cases reported during 2002 and 2003 in the United States represents the largest WNV epidemic ever recorded. The project described in this article was presented as an applied project to partially fulfill requirements for a master of science degree in environmental technology management from Arizona State University. This work was primarily concerned with environmental factors that appear to contribute to the spread of human WNV infection in the United States. Initial project activities included review of existing historical literature on the spread of WNV, the national climatological clearinghouse literature for precipitation and temperature data, and publicly available literature on major migratory bird flyways. This information was used to develop a GIS-based human WNV infection model that correlated human WNV infections with these three components:
Methodology UsedThis research included an initial review of those environmental factors that appear to contribute to the spread of WNV. This project assumed three primary components in the transmission of WNV: wild birds infected with high levels of WNV, bridge-vector mosquitoes that feed on these birds, and humans who are bitten by the mosquitoes. The environmental factors analyzed were those that could affect one or more of these components. Information in the following areas was procured
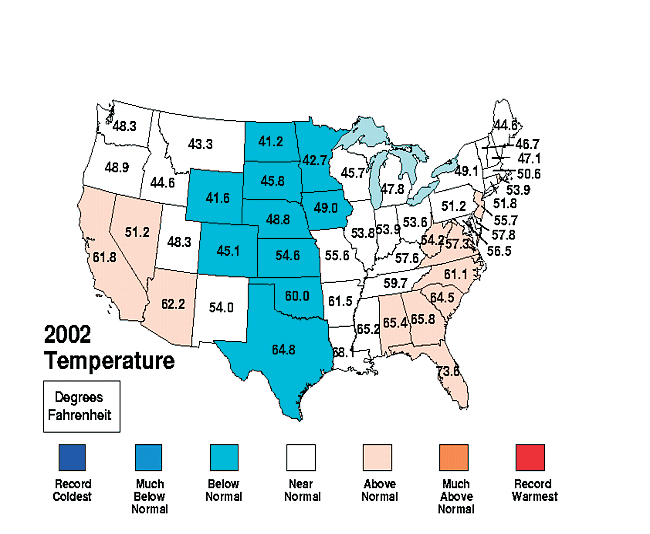
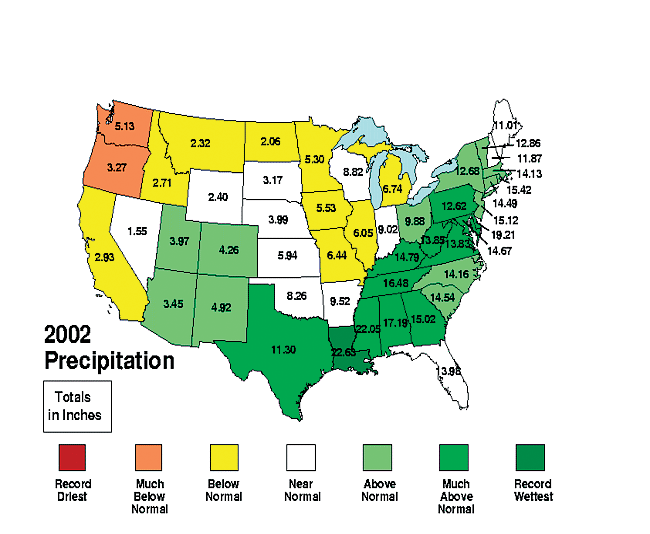
Location of, and any changes in, the major U.S. flyways used by wild birds suspected of involvement in the transmission of WNV. This information was used to formulate the human WNV infection model and then placed in the GIS. This article will address only environmental factors that contributed to the development of this model. Precipitation and Temperature DataAnnual precipitation and average temperature data was obtained from the National Oceanic and Atmospheric Administration (NOAA) Climate at a Glance Web site. The NOAA climate data from this Web site contained the total precipitation and average temperature data for each state from 1990 to the present. Using an online interactive GIS mapping application, interpretive maps for total precipitation and average temperature were prepared on a monthly basis from 1998 to 2002. Because the current WNV outbreak did not occur until approximately the third quarter of 1999, only the data from 1999 to 2002 was saved in a GIS attribute table. In an ArcMap session, the attribute table was linked to the generalized state shapefiles from the Esri Data & Maps sample data. Three maps—total precipitation, average temperature, and WNV human cases—were generated for each quarter and exported as JPG images. Geographic Locations of Human WNV ActivityData for determining geographic locations of historic human WNV activity was obtained from two sites. Data organized by state was obtained from the Centers for Disease Control and Prevention (CDC) Web site for climatological evaluation purposes. Data organized by county was downloaded from the Cornell University, Department of Communication & Center for the Environment, Environmental Risk Analysis Program Web site for use with the geographic location evaluation. Also, WNV human activity data for 2003, the most current available at the time, was obtained for each state-broken down by county-from the United States Geological Survey (USGS) WNV map Web site. This spatial data was combined with attribute data in the GIS. In the same ArcMap document, counties in each state with human WNV activity (or animal activity if no human activity had yet been identified) were selected, exported as discrete data features, and added to the data frame. Generalized major river features and major tributary river features from the Esri sample data were also added. In an effort to reduce feature clutter, a 30-mile buffer was drawn around each major river feature. The width of the buffer represented the average length of the river tributaries in a major river corridor. Once the 30-mile buffer was drawn, the major tributary feature was removed. An estimate of the elevation of specific geographic locations within the data frame was supplied by a generalized elevation map of the world. Noting Changes in Migratory Bird FlywaysResearch to discover any notable changes in migratory bird flyways was conducted via e-mail inquiries to appropriate staff at the U.S. Fish and Wildlife Service, the Audubon Society, and the American Birding Association. Additional research information was supplemented. A review of Cornell University's Project FeederWatch, annual rare bird sighting summaries, was conducted to see if there were any documented increases in rare bird sightings in particular geographic areas. This information for rare bird sightings was coded by city, created as a separate data feature, and added to the data frame. Although USGS has employed GIS to prepare interpretive maps showing the location of WNV activity for the CDC using CDC data, there are currently no GIS tracking tools available. Continued on page 2 |