ArcUser Online
The challenge was to identify zones, both beyond and before horizon lines, where structures block sight lines and detract from the view. The commission asked HVA for assistance in developing scenic ridge zoning that would preserve the town's scenic integrity by restricting development that could mar prominent ridges. The commission needed an empirical, defensible method for targeting the ridge zones where development should be restricted. Previous attempts had focused on single data sources, such as elevation or ridgelines, that did not correlate well with the scenic portion of ridges. GIS can integrate data sources and model data to identify the portions of ridges most conspicuous from Kent's roads. The commission's methodology targeted only ridges where development would break the horizon—where sky, rather than land, is the backdrop for a structure. A house with land as a background can be made less obtrusive than a house silhouetted against the sky. Vertical delineation of scenic resource zones on ridges was more challenging than horizontal delineation. The focus of delineation was the horizon line rather than the ridgeline. The horizon line is where earth and sky appear to meet when viewed from a specific location. Along the horizon line, structures of any height break the horizon. Tangents to the horizon line form sight lines. With increased distance beyond the horizon line, structures less than a certain height fall out of sight. With increased distance in front of the horizon line, structures also fall below the sight lines. The new methodology needed to determine zones beyond and before horizon lines where structures would rise above the sight lines. Maximum structure heights would be determined by current zoning regulations. The areas delineated by this new methodology were called horizon belts. Delineating Horizon BeltsData on roads, lakes, streams, and subbasins obtained from the Environmental GIS Data CD-ROM produced by the Connecticut Department of Environmental Protection (DEP) was used in determining the horizon belts. The DEP CD-ROM also provided digital topographic maps. United States Geological Survey (USGS) topographic maps were the source for both digital line graphics files and the digital raster graphics files. The USGS National Elevation Dataset Web site provided both 10-meter and one-third arc second resolution digital elevation model (DEM) data.
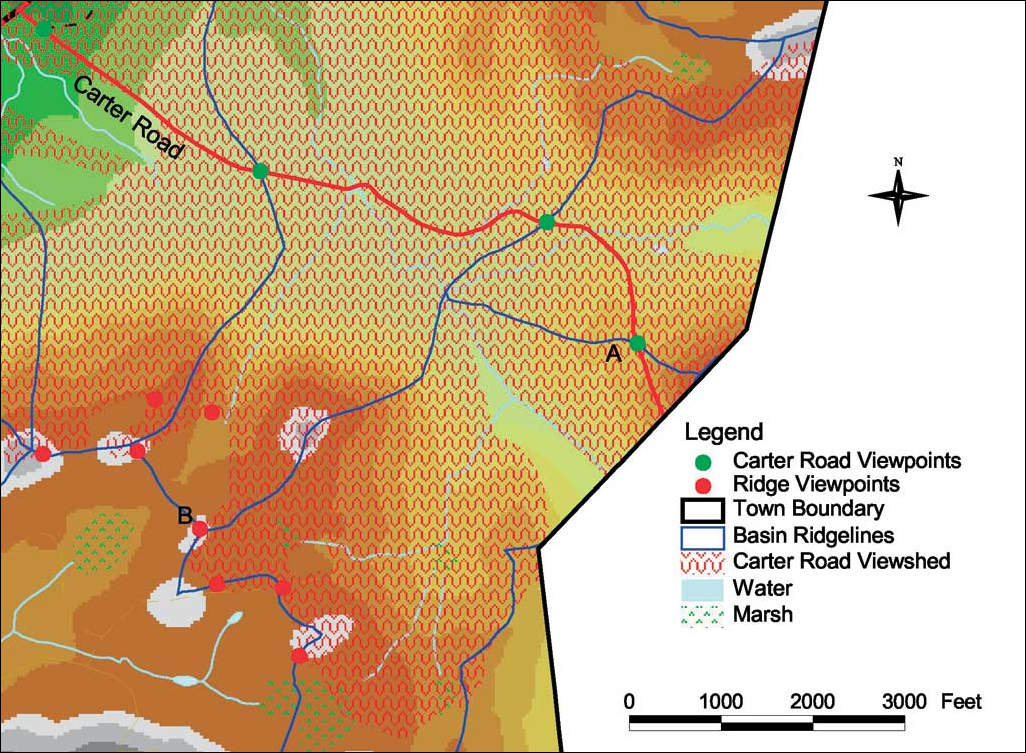
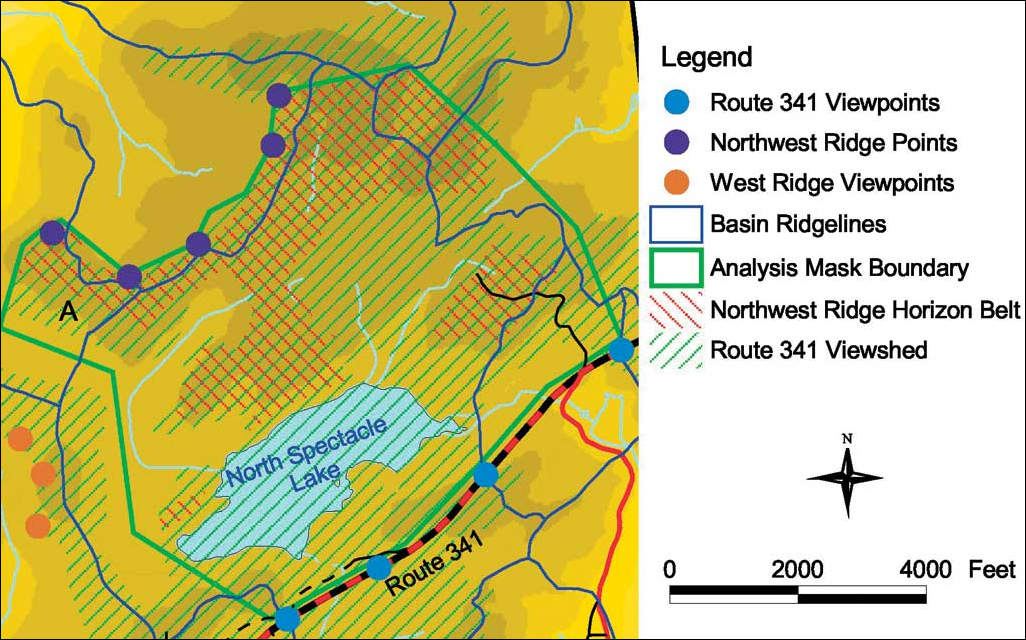
Using the ArcGIS 3D Analyst extension, a TIN model for the town of Kent was derived from the 10-meter resolution DEM data. Because lakes have constant elevation, they were used as breaklines for refining the TIN model. Ridgelines were derived from subbasin boundaries that had been converted to polylines. Polylines that did not correspond with topographically distinct ridges were deleted. Topographically distinct ridges that did not correspond to a subbasin boundary were manually added using topographic data as a guide. Road viewpoints, obtained from Kent's public roads, were chosen to correspond with the intersections of these road segments with other roads, the town boundary, subbasin boundaries (an indicator of high points along the road), and known vistas. The viewpoints were converted to a three-dimensional file. The elevation was derived from the TIN model, and a target offset value of 35 feet was assigned as an attribute for each viewpoint. The target offset value of 35 feet corresponded to Kent's current zoning regulations. Viewshed analysis used the TIN model to calculate areas of the landscape where a 35-foot structure would be visible from at least one of the selected viewpoints and generate a grid. This grid was reclassified. Cells visible to any viewpoint were assigned a value of 1 and cells not visible to any viewpoint had a value of zero (0). Using ridgeline data, the portions of road viewshed that corresponded to the ridges were identified. A ridge viewpoint file was created that corresponded to the back edge of the viewshed traversing a ridge. The ridgeline was used only as a horizontal guide for the location of the ridge. The back edge of the viewshed and the corresponding ridge viewpoints could extend beyond or fall short of the actual ridgeline. At least three ridge viewpoints were selected—two from near the ends of the ridge and one from a high point along the ridge. Additional viewpoints were added for divides as indicated by ridgelines and were also added at viewshed junctions where the back edge of the viewshed changed direction sharply. Viewshed junctions represent locations viewed by more than one road viewpoint. The ridge viewpoints were converted to a three-dimensional file with elevations derived from the TIN model. Both target offsets and observer offsets of 35 feet were assigned as attributes to all viewpoints. Analysis masks were used to constrain the viewshed analysis from the ridge viewpoints to a limited area. Areas behind ridge viewpoints were of no concern and were excluded by the masks. Analysis masks also were used to segment concave ridges and create separate horizon belts for each ridge segment. Without this segmentation, a false horizon belt could be created by the viewshed from an opposing ridge's viewpoints. Continued on page 2 |