ArcUser Online
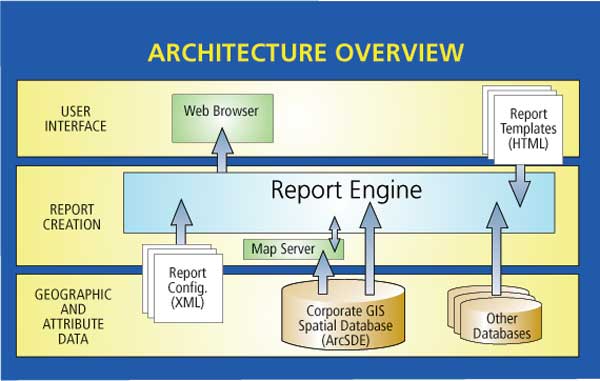
Denver Maps is an integrated mapping and reporting Web site that provides Denver citizens, businesses, and visitors with convenient access to location-based information for the city and county of Denver. It lets users find public information quickly and easily online. Denver Maps provides data from many agencies ranging from the Mayor's Office of Economic Development to Public Works and is assembled from various databases, citizens records, old hard-copy maps, and new and existing data collection projects. Denver Maps provides a one-stop location for accessing city and county location-based information, downloading maps, and creating custom maps. Serving All UsersEnsuring that Denver Maps was accessible to all users, including those with disabilities, was a major goal for the project. It voluntarily strives for compliance with federal government Section 508 standards and Double-A (AA) conformance with the W3C Web Content Accessibility Guidelines 1.0. Providing map-based information in an accessible manner presents many challenges. All searches can be performed without map interpretation or interaction. Search results displayed on a map are also provided in textual sections below the map. Links are provided to all sections of textual content, and the sections of each report are organized into a heading hierarchy to enable quick navigation with a screen reader or other outline-capable browser. To achieve its accessibility goals, the Denver Maps reporting system imposes constraints on all content. Because not all goals could be enforced by the reporting system, additional testing on all content through automated testing and user checks ensured that these goals were met. Architecture OverviewDenver Maps multi-tiered architecture separates the GUIs, database, and business- level objects. GIS data is stored in an Oracle database running ArcSDE. Nonspatial data is served from Microsoft SQL Server databases or in any other format that can be read through ActiveX Data Objects (ADO). Denver Maps utilizes HTML templates for its GUI, ASP with VBScript business objects, and XML report configuration files. This makes Denver Maps easy to maintain. If an agency wishes to share data with the public, new reports can be quickly added.
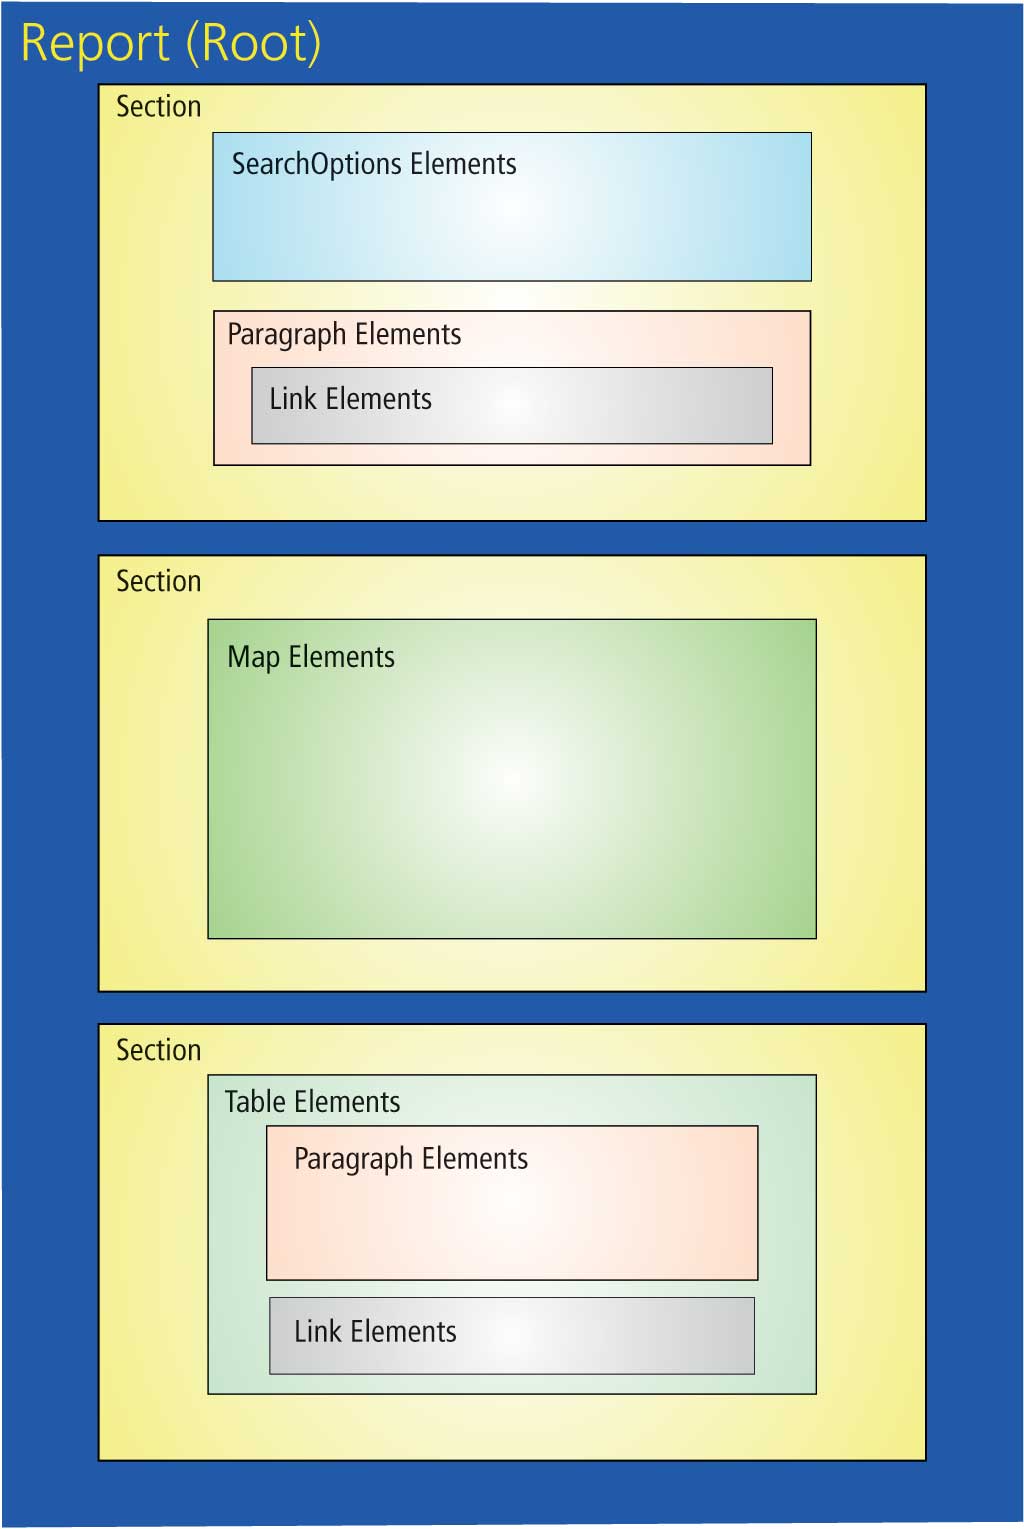
DenverGIS' HTML Template model uses an HTML template engine to turn simple HTML template objects into usable pieces of a report. The look and feel can be controlled by simply updating the look and feel of the templates. Template objects include a table template, a map template, a search options template, and other objects typically included in reports. The business objects, written using ASP with VBScript, are designed to be independent objects. Individual objects can be enhanced or new objects created without disrupting other objects. These objects are used for actions such as creating an ArcIMS recordset, performing spatial queries, and translating XML configuration files to build reports dynamically. Business objects are also used to read and display the HTML report templates. The use of XML for configuration files allows DenverGIS to identify which objects should be included in a report, how a report should behave, and how a report should look. XML files set constraints on which objects are allowed to interact with other objects and define how objects should interact. Recordset definitions, actions, report sections, and other information needed to create a report are contained in XML files. These XML configuration files speed creation of new reports. View Data in Unique WaysDenver Maps is a report-based system. Users can view data in unique ways because the information is presented in an interactive report format. Reports are grouped into logical categories that contain similar types of information and allow for location persistence between reports. Each report provides information about a specific topic and includes search options, maps, subreports, and link sections that provide details about features at a location. At the top of a report is the title bar that contains links to various categories: Denver Maps home page, the city and county home page (www.DenverGov.org), and a keyword search. The user can enter a keyword and find all reports associated with it. The search options section, located under the title bar, lets the user navigate easily to a specific location such as an address or neighborhood. Location persistence, a unique aspect of Denver Maps, allows users to jump between reports while maintaining location reference. For example, a user who entered a specific address on the property report then selected the election report would be redirected to the election report and zoomed to the election precinct for the previously entered address. The map section includes an interactive map, a reference map, and a legend. The interactive map allows users to zoom in and out, zoom to full extent, pan, re-center the map at a specific location, and select a feature at a specific location. Below the map, the user can toggle optional layers on and off. The reference map highlights the user's current map location in relation to the city and county of Denver boundary. The legend displays symbology for a select set of layers displayed on the interactive map. The report section, located below the map, contains attribute information associated with the selected location. This information is displayed using various objects including tables, paragraphs, links, images, and precompiled documents. The related links section at the bottom of the report includes links to associated Web sites, phone numbers, and precompiled documents. Continued on page 2 |