ArcUser Online
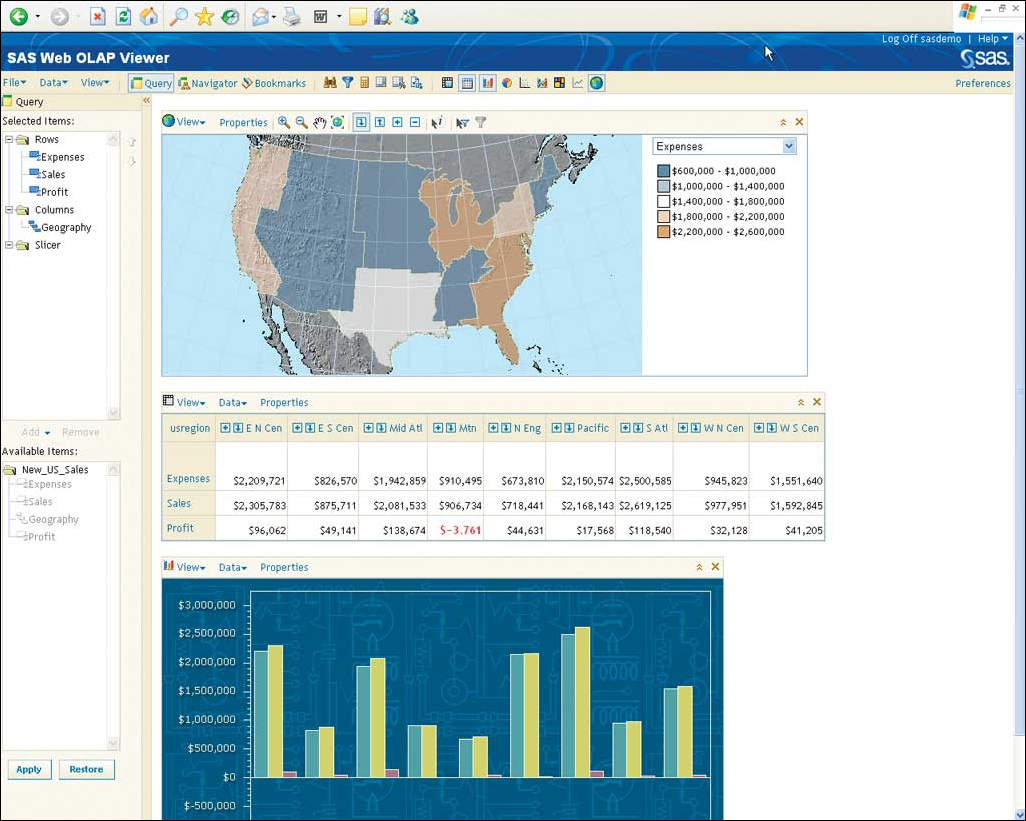
In each step, the map extents are recalculated to include only the region shown in the OLAP hierarchy. While there aren't universal terms for defining regional hierarchies within a country, the concept does exist. Whether at the state, province, or division level, the idea of one or more geographic hierarchies within a country is ubiquitous. In business cases, these hierarchies are frequently defined based on business rules. Sales territories may or may not follow political boundaries such as country or state. Shipping regions may be defined by travel time or distance from supplier or any other criteria that is important to a business. How OLAP Linking Works
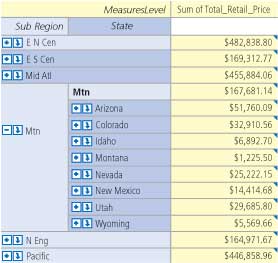
First, let's consider an OLAP hierarchy that includes levels of Region, State, and ZIP Code with aggregated total sales at each level. Using traditional OLAP analysis and reporting tools, it would be easy to see a tabular representation of this data at any of the specified levels. Depending on the OLAP tool being used, it might look like the example in Table 3. A single application attempting to provide a synchronized view of a single OLAP cube would need to ensure the measure value, such as Total Retail Price, is linked to the correct map area at each level of the OLAP hierarchy. When this data is managed in an OLAP storage mechanism, traditional OLAP reporting tools use queries to retrieve data values and client-based or Web-based tools to display them. Similarly, if the data were extracted and merged with the attribute data of an Esri layer or shapefile, the Esri toolset provides many options for geographic display. The steps needed to merge this data into an attribute table are very similar to the steps a single application must perform "under the covers" to ensure accurate linking. Namely, a unique key value is needed for each value of an OLAP level that matches the value of a specific field in an Esri map layer. Mapping Capabilities within OLAPWhile the OLAP-to-map linking is very powerful, it is often useful to use traditional map navigation and query tools to interact with the map irrespective of the OLAP data. A cube with state, county, and ZIP Code levels may not have data aggregated below the ZIP Code level. However, using a map makes layers containing information on census tracts, block groups, or street level available without corresponding changes to the OLAP table view. The synchronization with OLAP begins again when an OLAP event, such as Drill or Expand, takes place. Also, there may be additional information stored in the map attribute table that is available through an identify action. The OLAP data may contain sales information by region, but the GIS attribute data may also include population, income, or other demographic information. All of the information that would traditionally be available through a map identify action is still available in an OLAP/GIS-enabled environment. This is a very powerful feature that truly extends functionality rather than replacing one set of features with another. Where Do We Go from Here?The ideas and implementations described here are currently available in products from SAS and Esri, but they are just the beginning of what is possible. (See page 6 of this issue for an article about the OLAP for ArcGIS add-on.) It is hard to imagine an industry that wouldn't benefit from a tighter integration of mapping and advanced analytics. Marketing automation, demand planning, supply chain optimization, and fraud detection are only a few business activities that provide opportunities for this integration. Using drive-time calculations or distance from irregular geographic features (e.g., lakes and rivers used for water supply) as input to data mining applications adds an extremely valuable component to analytic models, which results in better business decisions. ConclusionTraditional decision support systems, including those using OLAP technology, have always benefited from including graphic visualization techniques such as bar and pie charts. Most of these systems also rely on data sources that contain location information, and this information is as critical as any other dimension of the data. The most logical way to understand and interact with this aspect of data is through maps. Because of this, there is a tremendous opportunity to combine OLAP analysis with geographic mapping to unveil new insights into business operations and make better decisions on future business directions. For more information, contact Gail Kramer Stuart Nisbet SAS Institute Inc. About the AuthorsGail Kramer is senior director of research and development for Business Intelligence Client Applications at SAS. This includes client applications such as Web Report Studio, Information Map Studio, SAS Enterprise Guide, SAS Add-In for Microsoft Office, and AppDev Studio. Kramer has a background in developing GUI-based products at SAS and has moved into the business intelligence space. She has also managed other GUI products, including the first one developed at SAS. Kramer was also the manager and original developer of both SAS/ASSIST and SAS/EIS. She holds a bachelor's degree in computer science from North Carolina State University, Raleigh. As R&D director for the Business Intelligence Platform Division at SAS, Stuart Nisbet currently oversees software development efforts of SAS' Output Delivery System; SAS/AF; SAS/FSP; and a suite of graphics products, reusable components, and device drivers. Since joining SAS in 1987 as a software tester, Nisbet has managed various development, testing, and usability groups at SAS' corporate headquarters in Cary, North Carolina. Prior to coming to SAS, he worked in automation testing at IBM. Nisbet holds a bachelor's degree in computer science from North Carolina State University, Raleigh. |