KARSTERO
Editor's note: The authors created a model for predicting soil erosion hazard using ArcGIS ModelBuilder.
Erosion hazard is a major land degradation problem in Mediterranean environments.
Consequently, many models have been developed for quantifying soil loss or pinpointing areas suffering from soil erosion. Although increased use of GIS led to a great many GIS-based model applications at the catchment level and larger scales during the past decades, there has been no emphasis on predicting erosion hazard for specific environments such as the peculiar and attractive karst landscapes commonly distributed in the Mediterranean region.
 |
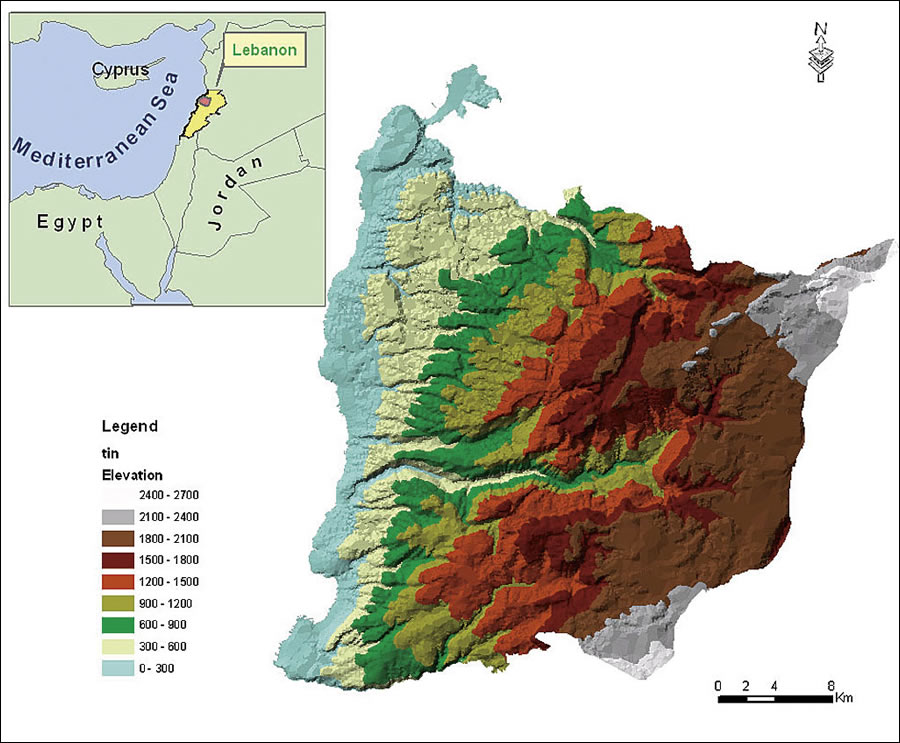
| The study area for developing the KARSTERO model is a 1,062-square-kilometer area located in the East Mountains. |
In Lebanon, this landscape makes up 70 percent of the country's total area. This environment contains particularly fragile ecosystems because thin soils that have low fertility and readily succumb to desertification predominate. In addition, poor land management practices increase soil erosion and the detrimental effects of human activities, such as deforestation, burning, and overgrazing in karst areas, leave only barren soils that are vulnerable to the effects of intense rainfall.
The goal of this project is conceptualizing—in a GIS framework—a regional, quantitative, and empirical model that would predict erosion in dynamic karst landscapes at a scale of approximately 1:100,000 meters. The study area for developing this methodology is a 1,062-square-kilometer area located in the East Mountains. These mountains, with peaks reaching 2,698 meters, contain numerous types of karst formations such as lapiez [i.e., lapies], sinkholes, and exposed karst. Soil loss studies predict erosion rates reaching as high as 70 tons per hectare. In addition to many seasonally developed channeling systems, three permanent streams—El-Jawz, Ibrahim, and El-Kalb—are carving up the study area. Four microclimatic zones exist and range from the coastal subhumid to the mountainous oromediterranean. Between 75 and 80 percent of annual rainfall is concentrated between November and April. Intense rain showers of more than 100 millimeters in 24 hours are common.
| Data Source | Geoprocessing Tool | Process Output | Raster Classification Tool | Classified Raster | Percent Influence |
| Drainage | Line Density | Drainage Density | Drainage Reclassify | Drainage Infiltration Index | 10 |
| Lineament | Line Density | Lineament Density | Lineament Reclassify | Lineament Infiltration Index | 35 |
| Topography | Feature to Raster | Karst Raster | Karst Reclassify | Karst Infiltration Index | 15 |
| Geological Map | Feature to Raster | Lithology | Reclassify | Rock Infiltration Index | 40 |
Derivation of the layers and the percentage of influence assigned to each Weighted Overlay operation that was used to obtain the final Rock Infiltration (RI) parametric raster layer
Designing the KARSTERO Model
The proposed model, called KARSTERO, considers soil erosion caused when soil particles are detached by the impact raindrops and transported by runoff. This model calculates soil loss by incorporating both endogenous (internal)/quasistatic and exogenous (external)/dynamic parameters. Because these parameters do not have an equal effect on erosion hazard, they are not given the same weight. The soil loss equation, along with its component parameters, is shown below in Figure 1.
 |
| Figure 1: Parameters used in the soil loss equation |
Endogenous/Quasistatic Factors
The factors considered under this heading included rock infiltration, soil erodibility, and morphology.
Rock Infiltration (RI)—High rock infiltration indicates recharging of considerable amounts of water into subsurface strata, which diminishes potential runoff and decreases the quantity of transported particles. Infiltration is a function of a number of interactive factors—lithology, lineament frequency density, karstification, and drainage density)—that can be manipulated using GIS.
Lithology—To extract the lithological formations, three 1:50,000-scale geological maps covering the study area were registered using the georeferencing tools in ArcGIS 9.1. All lithological formations were then delineated by heads-up digitizing. Using ModelBuilder, the vector shapefile created through digitizing was converted to a raster. Depending on the rock type, the previously obtained raster was classified into five classes based on rock infiltration capacity using the Reclassification tool and ModelBuilder.
Lineaments Frequency Density—Lineaments [i.e., topographic features that are thought to represent hidden crustal structures, generally associated with high infiltration rates] were extracted from geological maps and through visual interpretation of georeferenced Landsat 7 ETM+ 30-meter satellite imagery. The lineament density map was established using the Density command in the ArcGIS Spatial Analyst extension. The raster layer obtained was reclassified into five classes according to the infiltration rates. Higher values were assigned to more dense areas to define the infiltration index rates raster.
Karstification—Three topographic maps at 1:50,000-scale, created by the Department of Geographical Affairs of the Lebanese Army, were scanned and registered, and related features such as sinkholes, lapiez, and covered karst, were delineated by digitizing. In a similar way, the vector shapefile was converted to raster using geoprocessing tools and ModelBuilder. The infiltration index was assigned by reclassification.
Drainage Density—The drainage lines were digitized from topographic maps, the resulting shapefile converted to a raster and classified, and the drainage infiltration index layer created.
 |
| Three classified rasters were derived from the soil shapefile and classified. The Weighted Overlay tool was applied to generate a raster describing soil erodibility. |
All involved factors do not have the same effect on the rock hydrologic infiltration property. Some of them may increase or decrease infiltration. The corresponding weights for RI stated in the third equation in Figure 1 were assigned using Weighted Overlay in ArcGIS to obtain the final RI parametric raster layer.
Soil Erodibility (SE)—Three physical properties of soil were used to determine susceptibility to erosion—texture, organic matter content, and soil depth. The soil maps at 1:50,000 scale provided by the Remote Sensing Centre were scanned and registered, and the soil units were digitized. In the attribute table for soil shapefile, three new fields for texture, organic matter, and soil depth were created.
For each soil unit polygon, related values were added in the corresponding field. To prevent adjacent polygons that had the same values from sharing boundaries, the Dissolve by Attribute option was used and texture, organic matter, and soil depth layers were established and converted to rasters. Rates of erodibility (or Utility Values) were assigned for each layer through Reclassification. The three rasters were combined using Weighted Overlay, and the final Soil Erodibility (SE) parametric raster layer was established.
Morphology (M)—Three primary terrain attributes were calculated from a 10-meter digital elevation model (DEM) provided by the GIS unit of the Lebanese Remote Sensing Centre using the slope gradient, aspect, and curvature algorithms in the ArcGIS 3D Analyst extension. The three derived rasters were reclassified based on the effective rate of erosion and combined by assigning weights using Weighted Overlay and producing the Morphology (M) parametric raster layer.
Exogenous/Dynamic Parameters
To produce these parameters, data on land sensitivity (land cover/land use) and rainfall erosivity were considered.
Land Sensitivity (LS)—Land cover/use is a significant dynamic parameter affecting the erosion process. Water erosion reaches its maximum when the soils are bare and kept without protection against rainfall. A digital vector 1:50,000-scale land cover/land use map of the study area was provided by the GIS unit of the Lebanese Remote Sensing Centre. The shapefile was converted to a raster, five influence rate classes were assigned using the reclassification option in ModelBuilder, and the final Land Sensitivity (LS) parametric raster layer was obtained.
 |
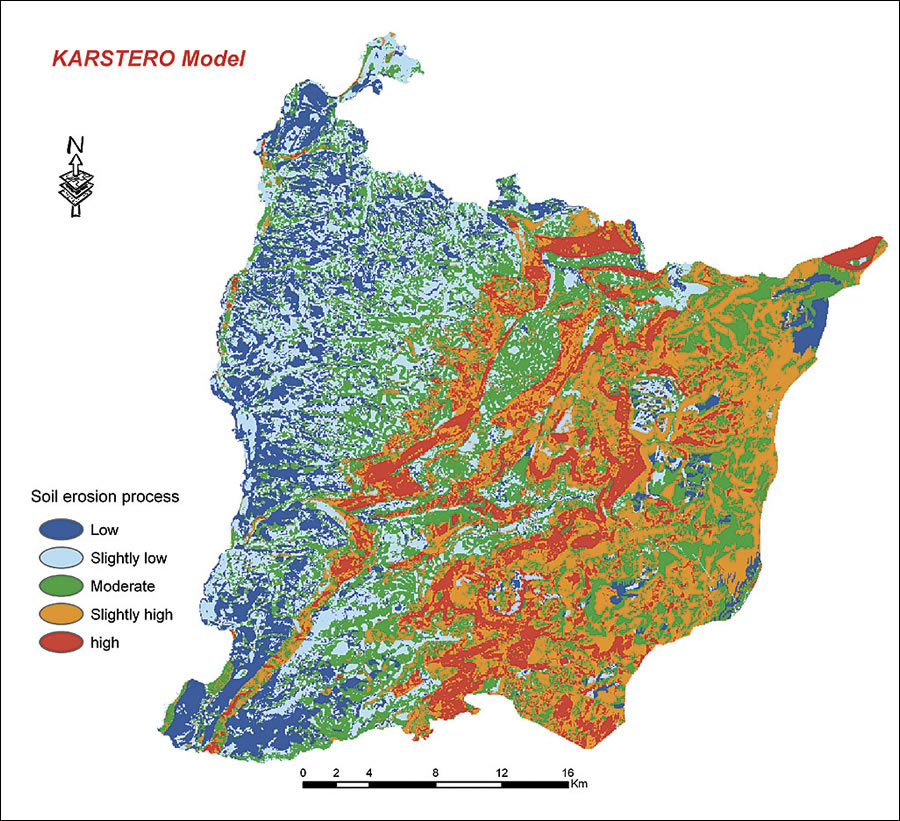
| The KARSTERO Model created a soil erosion processes layer for the study area. |
Rainfall Erosivity (RE)—High rainfall quantities are indicative of important soil loss quantities. The same procedure was followed to obtain the RE layer. First, the digital rainfall map was converted to raster, then reclassified according to the erosion processes into five classes using all the above-mentioned tools in ModelBuilder.
All five parametric raster layers were combined, a weight assigned for each parameter as indicated in the the model in second equation in Figure 1, using the Weighted Overlay tool. This resulted in a soil erosion process layer for the study area.
Model Validation
A validation run of 160 sites was conducted for a period from the beginning of November 2004 to the end of April 2005. This period coincided with the critical erosion period for the area. For each site, the tributaries of each linear system were counted and the dimensions measured. For each linear channel, readings of depth and width were taken within an interval of 10 percent of the total curved length of the channel.
Eroded volume in cubic meters per year for each linear channel was calculated by multiplying the average cross-section area (depth x width) by the total length. The total volume for each site is equal to the mean eroded volume multiplied by the number of detected gullies in the field. Where there was no erosion, zero values were recorded.
A statistical validation of the model was performed by arranging the obtained linear channel volumes into five classes and comparing them with modeled erosion classes.
Conclusion
The KARSTERO model can define, for a representative region of Lebanon, a map showing erosion risk with five classes. This map is the result of modeling available knowledge and data and can serve the needs of a variety of researchers and decision makers. It has advantages over physical- and event-based models, which require too much data to be applied at a regional scale. If the functional capacities of ArcGIS are used, this model can be easily extrapolated to the entire country. Using ArcGIS ModelBuilder, new spatial data can be added and codes modified to automatically analyze basic and factorial data.
For more information, contact
Chadi Abdallah
Lebanese National Council for Scientific Research
Remote Sensing Centre
P.O. Box 11- 8281
Sport City Boulevard, Bir Hassan
Beirut, Lebanon
E-mail: chadi@cnrs.edu.lb
Acknowledgment
Special thanks to Khatib & Alami (the Esri distributor in Lebanon) for its support and advice.
About the Authors
C. Abdallah works at the Remote Sensing Centre. He holds a master's degree in GIS and remote sensing from Paris 6 University, France. A doctoral candidate in geoenvironmental hazards, he is involved in many international and local research projects that use GIS techniques. He can be reached at chadi@cnrs.edu.lb.
R. Bou kheir, researcher at the Remote Sensing Centre, holds a doctorate in the application of remote sensing and GIS in soil water erosion. She has directed several regional and international projects, and her interest includes land degradation and environmental management. She can be reached at raniabk@cnrs.edu.lb.
M. Khawlie, director of the Remote Sensing Centre, received his doctorate in geology and environment from Illinois University and has more than 30 years of experience in both research and management. He can be reached at mkhawlie@cnrs.edu.lb.
|