ArcUser Online
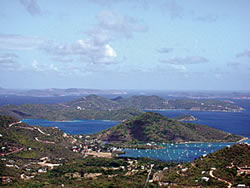
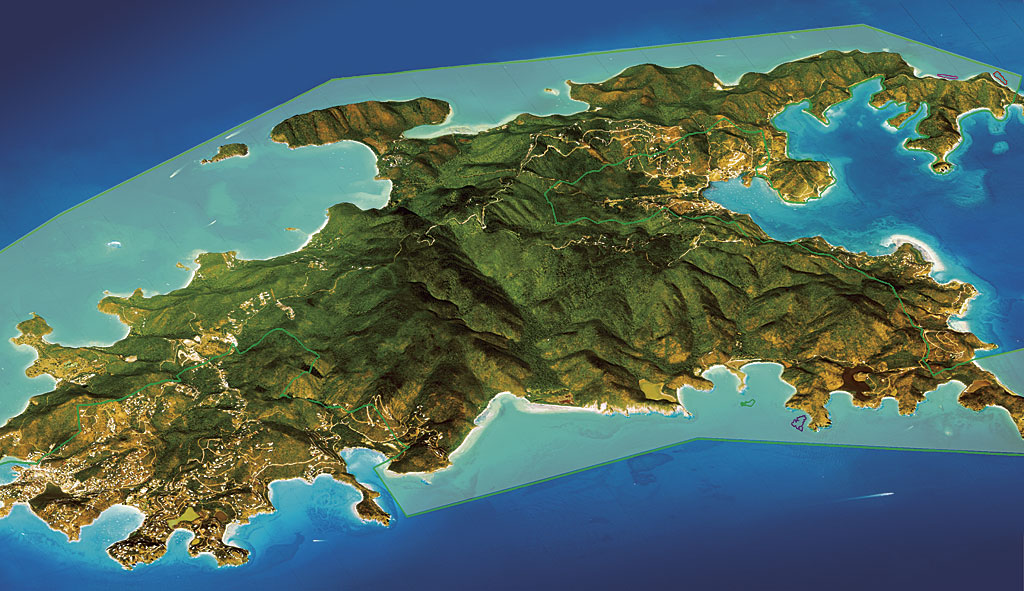
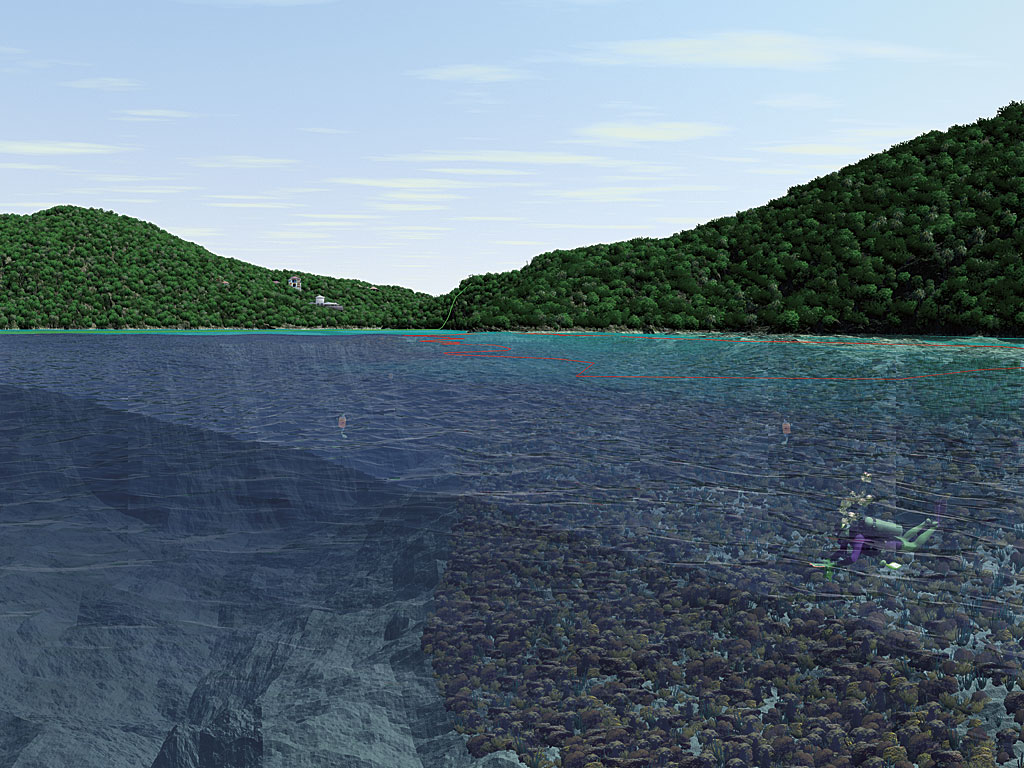
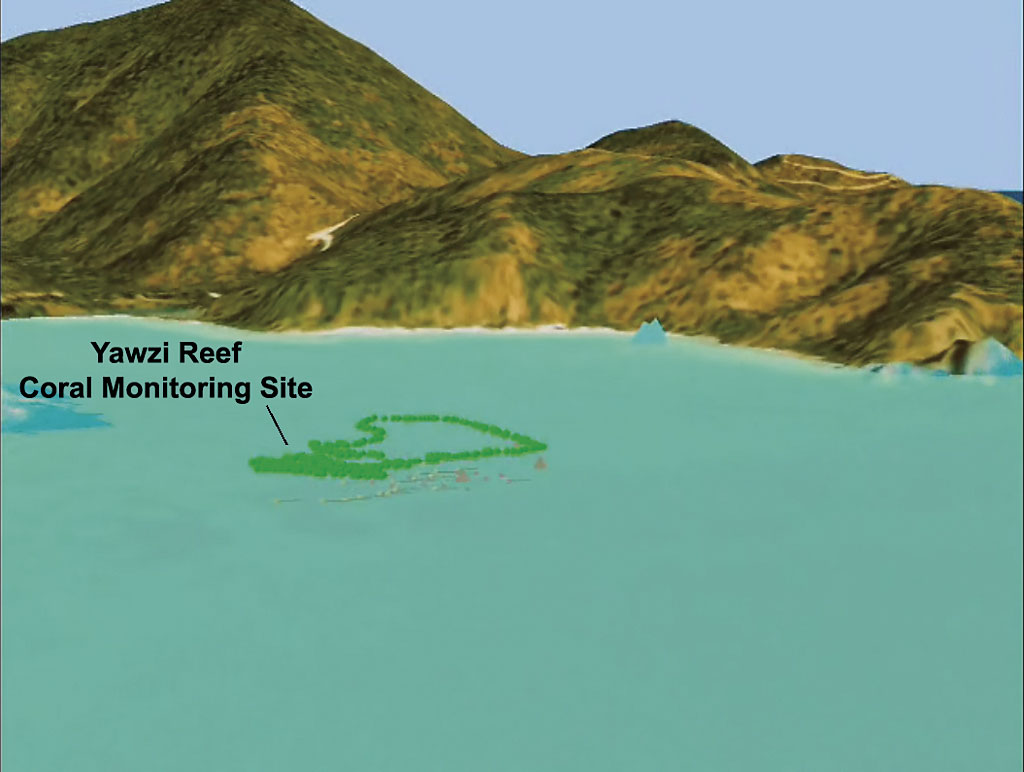
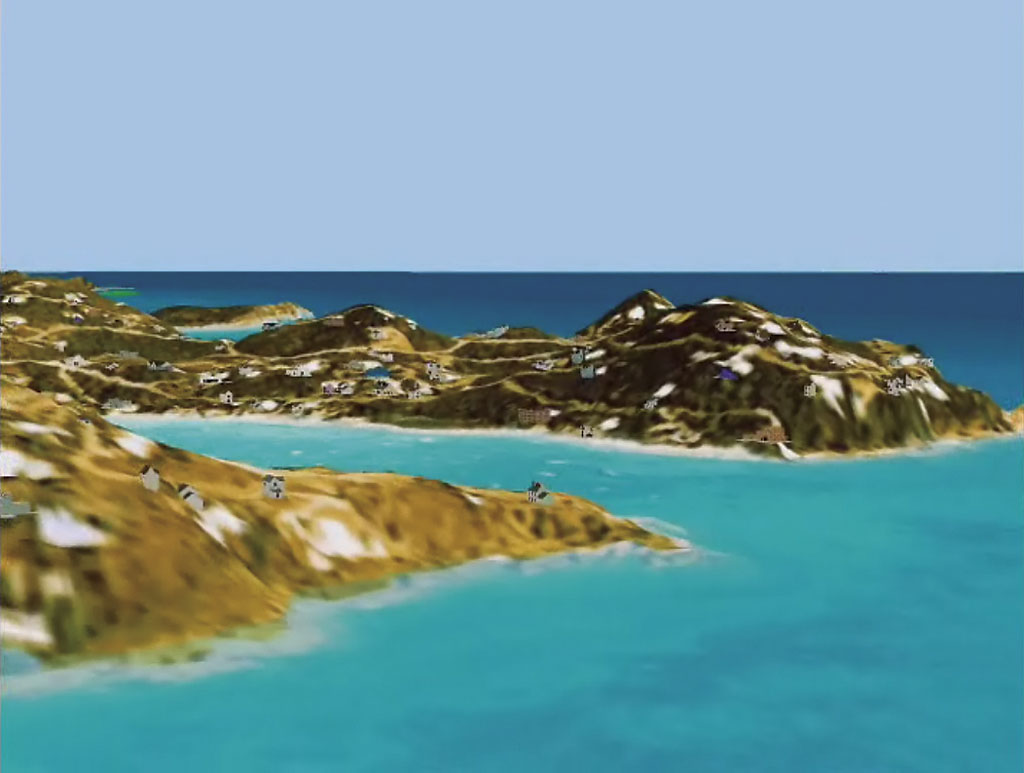
Visualizations can let people explore places that they may never visit in person. Three-dimensional imagery of the offshore coral monitoring sites as well as terrestrial monitoring sites managed by the National Park Service (NPS) and other agencies can be used by park personnel and as part of public outreach efforts and education activities. Increasing public awareness about park-related environmental issues is particularly important. Past research suggests that the degree of familiarity that the public has with the park's ecosystem may influence the actual economic value that the public places on preserving this resource. The South Florida/Caribbean Network (SFCN) of the National Park Service used lidar imagery to produce three-dimensional visualizations of monitoring programs at Virgin Islands National Park. High-resolution lidar digital elevation models (DEMs), obtained through a partnership with the National Aeronautics and Space Administration (NASA) and the United States Geological Survey (USGS), were paired with aerial imagery of St. John, United States Virgin Islands (USVI), using the ArcScene application in the ArcGIS 3D Analyst extension. Virgin Islands National Park is located approximately 1,115 miles offshore of the contiguous United States. The park boundary encompasses 14,695 acres, of which 5,919 acres (40 percent) are marine and 8,775 acres (60 percent) are terrestrial. Obtaining DataThe high-resolution topographical information for a park with both submarine and terrestrial resources was obtained through the use of the NASA Experimental Advanced Airborne Research Lidar (EAARL) sensor.
The term lidar is an acronym for light detection and ranging. Lidar instruments are often flown in small aircraft and utilize an active remote-sensing technology. Laser light is pulsed downward, where it interacts with surface or near-surface objects and reflects back to the lidar instrument. The time between the initial pulse and separate returns provides information on different layers of topography (including tree canopy, bald earth, water level, and submarine topography). In 2003, a lidar survey was flown over most of Virgin Islands National Park to obtain both terrestrial and submarine topography data products. In this case, the layers of primary concern from the lidar data were the last surface returns (or bare earth in terrestrial areas and submarine topography in marine areas). With overlapping flight lines, the spatial resolution was approximately one laser pulse per square meter with a vertical accuracy of approximately 15 centimeters. SFCN, USGS, and NASA collaborated to transform this lidar data into an interpretable product for researchers, park staff, and park visitors. After postprocessing and raster editing, these lidar DEMs were merged with offshore National Oceanic and Atmospheric Administration (NOAA) bathymetry data to create virtual tours of the park resources that would be available for park visitors and others. The lidar DEM was used to produce three-dimensional imagery of onshore bald earth topography and offshore submerged topography at one- to two-meter resolution. The onshore visualizations use lidar elevation values to define the land surface of the aerial photographs, and the submerged topography visualizations use the lidar DEM as the surface of the ocean floor and the aerial imagery as a semitransparent water level layer. Preparing the DataThe USGS-NASA-NPS partnership that produced these NASA EAARL products involves a different type of data processing for terrestrial versus submarine environments. The NASA EAARL system can only measure submerged depths up to 25 meters in ideal conditions and 15 meters on most flights. For this visualization, the lidar dataset and a NOAA bathymetry model were merged to create a seamless DEM for the entire area of Virgin Islands National Park and the surrounding environment. It was essential that this DEM be seamless with no data holes or anomalies that would affect the appearance of the image. Small anomalies in the DEM would appear as noticeable holes or spikes when displayed in the ArcScene GIS.
The first step in this mosaicking procedure was to create a boundary shapefile along the edge of the NO DATA values in the lidar product. These NO DATA gaps within the DEM and along the borders were assigned values of �100 during the data processing done by USGS. Because the NASA EAARL instrument can take measurements down to 25 meters in submerged environments under ideal conditions, the boundary shapefile was created using a conditional analysis in the raster calculator so that the lidar data was delineated at equal to or greater than �20 meters. All other data values were considered inaccurate or as NO DATA holes. Using the Convert Raster dialog box and deselecting the generalize line box, the raster was converted to a feature dataset. This step was essential in creating a seamless DEM because the polygon lines needed to follow the pixels of the dataset exactly. If they did not, the pixels would be split in the clipping procedure and create NO DATA slivers. This shapefile was split into two shapefiles along the defined boundary. Both DEMs were clipped using the Raster Calculator with the analysis mask set at the conversely defined boundaries of the lidar dataset. The cell size for both of these clip operations was set at one meter, the cell size of the lidar DEM. This was done so the pixels of each image would line up perfectly with the boundary defined by the clipping shapefile. The two DEMs were merged using the Raster Calculator with the analysis extent set to the union of inputs, the cell size set to 1, and with no analysis mask. Map Preparation
High-resolution aerial photographs were used from the 1999 NOAA Puerto Rico and the U.S. Virgin Islands Benthic Mapping Project. Imagery was added to an ArcScene project, and base heights were set using the mosaicked DEM. Raster resolution was left at 10 meters until the entire project was completed. The image was set to resample during display using bilinear interpolation for continuous data. All the feature datasets were added and, where possible, displayed using three-dimensional objects and labels. The scene was recorded using the animation toolbar built into ArcScene with key frames placed at desired intervals, then the video file was exported in Audio Video Interleave (AVI) format to reduce file compression. For the video export, the raster resolution was set at five meters. ResultsThe video product as well as still images have been previewed by park resource management staff and will be made available for public use and exploration. These products should be available in the park interpretive center and on the Virgin Islands National Park Web site. This is an ongoing part of a USGS-NASA-NPS partnership that involves gathering and processing lidar data for three of the seven national parks in the SFCN as well as at least nine other parks in the National Park Service system. These datasets will be processed for use in a standard GIS by the SFCN office. Future applications may include other three-dimensional visualizations for park outreach. Currently, three-dimensional visualizations for Biscayne National Park as well as the visualization discussed in this paper for Virgin Islands National Park are available for public exploration on the SFCN Web site at www1.nature.nps.gov/im/units/sfcn/. Discussion
The use of three-dimensional visualizations for public education and park outreach should be further explored to gain attention for the preservation of these resources. Past research in the valuation of ecosystem services has related the value of natural resources to the sum total of human uses that the public can obtain from these resources. These values depend heavily on the public's familiarity with the resources and environmental issues as well as firsthand experience with these resources. Research also suggests that the overall value of the resources, which encompasses familiarity and many other factors, decreases and levels off with increasing distance from the ecosystem of interest. Virgin Islands National Park is a United States commonwealth territory and located approximately 1,115 miles offshore from Florida. Most Americans will never have the opportunity to personally experience this national park. Past research in ecosystem valuation suggests that this lack of familiarity negatively affects the value that the general public assigns to preserving the resources within the park. It is challenging to educate the public on the importance of preserving these out-of-reach resources. In the case of degrading coral reefs, it is essential that new ways to increase public interest be found to prevent further degradation of these ecosystems. The GIS that was created for these three-dimensional visualizations may be used in the future as a framework for building more realistic models, exploratory scenes of future monitoring programs at the park, and hypothetical scenarios of park degradation due to different human uses. This educational tool will increase public attention and future spending toward managing and preserving these and other imperiled national parks. For more information, contact Alexandra Wright South Florida/Caribbean Network About the Authors
Alexandra Wright has been working with the South Florida/Caribbean Network of the National Park Service since September 2005. She received a bachelor's degree in environmental biology and African studies from Beloit College in 2005. She has focused most of her time at SFCN on GIS data acquisition, spatial analysis of datasets for monitoring projects, map production, and three-dimensional map representations using both ArcScene and Visual Nature Studio. She is planning to start a doctoral program in plant physiology and invasive plant ecology in fall 2007.
Judd Patterson has been working with the SFCN of the National Park Service since October 2005. He received a bachelor's degree in biology and a secondary major in natural resources and environmental sciences from Kansas State University in 2005. His primary tasks have been a collaborative project to create lidar-derived digital map atlases for numerous park units as well as three-dimensional visualization using ArcScene. He is currently pursuing a master's degree in geography at Kansas State University. AcknowledgmentsThe authors thank the following members of the SFCN team for their support and ongoing help: Matt Patterson, Brian Witcher, Kevin Whelan, Andrea Atkinson, Jeff Miller, and Rob Waara. They also thank John Brock and Amar Nayegandhi, from the USGS Center for Coastal and Watershed Studies and everyone on the Esri user forum for contributing to such a useful online resource that made this project possible. ReferencesBrock, John C., C. Wayne Wright, Asbury H. Sallenger, William B. Krabill, and Robert N. Swift. 2002. "Basis and Methods of NASA Airborne Topographic Mapper Lidar Surveys for Coastal Studies," Journal of Coastal Research. 18(1): 72�73. Brock, John C., C. Wayne Wright, Matt Patterson, Amar Nayegandhi, Judd Patterson, Melanie S. Harris, and Lance Mosher. 2006. USGS-NPS-NASA EAARL Submarine Topography, Biscayne National Park. USGS Open File Report 2006-1118. Daily, Gretchen C. 1997. Nature's Services: Societal Dependence on Natural Ecosystems. Washington, D.C.: Island Press. Field, Michael E., Susan A. Cochran, and Kevin R. Evans. 2002. U.S. Coral Reefs—Imperiled National Treasures. USGS Fact Sheet 025-02. Jeffrey, C. F. G., U. Anlauf, J. Beets, S. Caseau, W. Coles, A. M. Friedlander, S. Herzlieb, Z. Hillis-Starr, M. Kendall, V. Mayor, J. Miller, R. Nemeth, C. Rogers, and W. Toller. 2005. "The State of Coral Reef Ecosystems of the U.S. Virgin Islands," 45�83 in The State of Coral Reef Ecosystems of the United States and Pacific Freely Associated States: 2005. J. Waddell (editor), NOAA Technicial Memorandum NOS NCCOS 11. NOAA/NCCOS Center for Coastal Monitoring and Assessment's Biogeography Team. Silver Springs, Maryland. 522 p. Silberman, Jonathan, Daniel A. Gerlowski, and Nancy A. Williams. 1992. "Estimating Existence Value for Users and Nonusers of New Jersey Beaches," Land Economics. 68(2): 225�236. Sutherland, Ronald J., and Richard G. Walsh. 1985. "Effect of Distance on the Preservation Value of Water Quality." Land Economics. 61(3): 281�291. Walsh, Richard G., John B. Loomis, and Richard A. Gillman. 1984. "Valuing Option, Existence, and Bequest Demands for Wilderness." Land Economics. 60(1): 14�29. Wright, C. Wayne, and Jogn C. Brock. 2002. EAARL: A Lidar for Mapping Shallow Coral Reefs and Other Coastal Environments (http://inst.wff.nasa.gov/eaarl/index.php?module=documents&JAS_DocumentManager_o p=downloadFile&JAS_File_id=3). Last accessed May 17, 2006. |