ArcUser Online
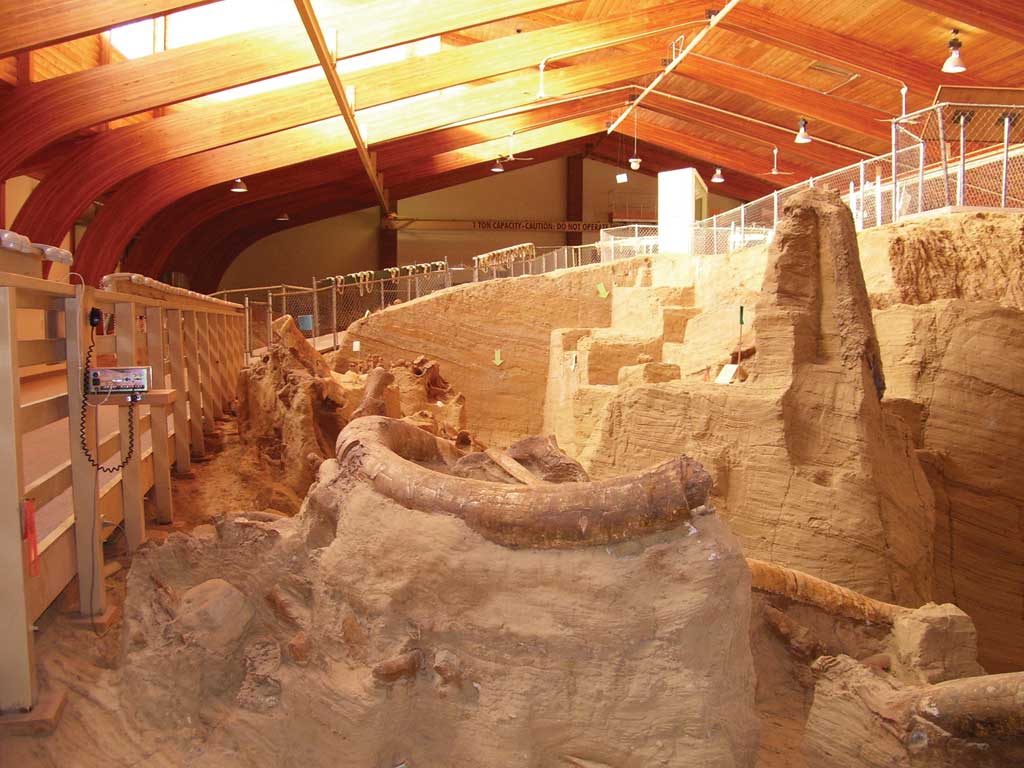
Scientists at a South Dakota research center are remapping the location of bones of Ice Age mammoths with GIS to preserve the context of the find and allow for the automation of quantitative analyses. The Mammoth Site of Hot Springs, South Dakota, is an indoor, in situ Pleistocene bone bed that contains the remains of at least 56 mammoths and numerous other Ice Age animals. Approximately 26,000 years ago, the bone bed was the site of a steep-sided warm-water sinkhole pond. The warm water and year-round vegetation along the edges attracted mammoths, but once in the pond, the steep sides prevented their escape. Although entrapment was probably a rare event, the sinkhole was active as a trap for 300 to 700 years, which accounts for the large number of remains. The site was discovered in 1974 during excavation for a housing development. Three mammoths were found during the first season. From the beginning, site mapping was a high priority. Mapping shows the location of each bone and records information about where it was found. By studying the bone bed's taphonomy [i.e., studying what happened to an organism between the time of its death and the time it was excavated], researchers can determine the environment of deposition and gain a clearer insight into the world of the mammoths. Early Mapping Methods
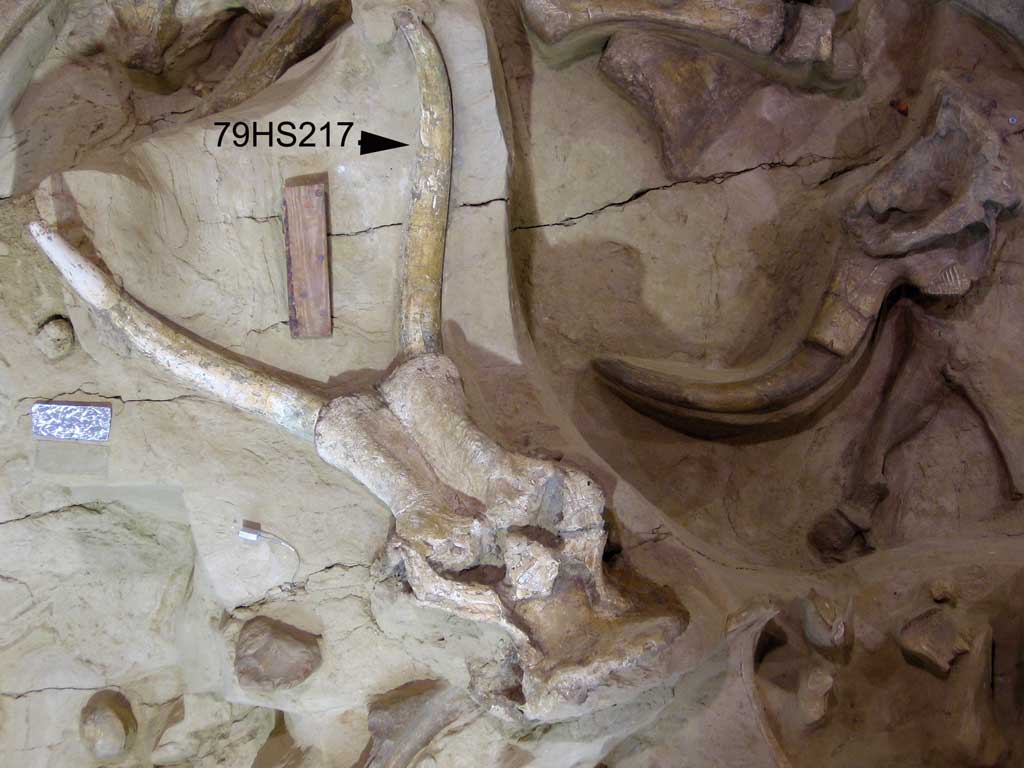
Initially, the Mammoth Site used a string grid to map the bone bed, and the cartography was entirely hand drawn. However, finding bones using one of these maps was like a treasure hunt. Most important, any quantitative analysis of a hand-drawn map also had to be done by hand. Early efforts to computerize the mapping process using CAD software and a Nikon laser transit met with mixed success. The software was not well suited to mapping, and the Nikon transit proved difficult to use in the bone bed. The resulting map permitted automated cataloging of the bone bed but was less accurate and less detailed than the old string-grid system. Enter ArcGISThe Mammoth Site recently embarked on a project to completely remap the bone bed using the latest technology. The center upgraded the GIS software to ArcGIS 9.2, bought a Trimble robotic transit, and improved site photography. These upgrades vastly improved map quality and opened the doors to hitherto impossible research. The Mammoth Site employs a complex photographic mapping process that starts with anchor points. These are actually four or more metal washers that are placed around a bone before it is mapped. Larger bones require more washers. The washers appear in each photograph, and the Trimble transit is used to shoot in the precise coordinates of each washer. Photos for Mapping and DocumentationWhile researchers use photographs to document the bones, photographs are also integral to the mapping process. Because the outline of the bone becomes part of the map, the photograph of the bone should be taken from directly above the bone on a level plane to avoid distortion.
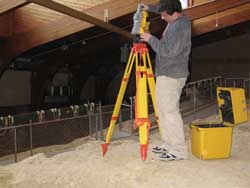
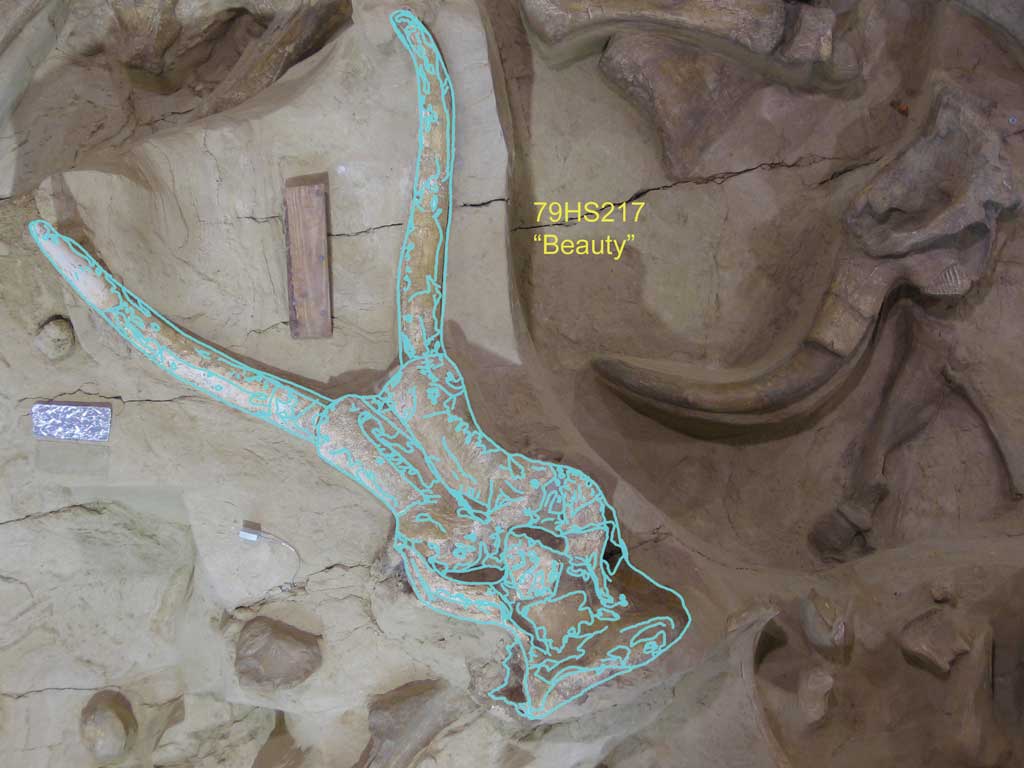
Good photographs of smaller bones can be made with a bubble level on the camera, but mammoth bones, such as a femur or skull, cannot be fit in a single picture taken from ground level. Photo-stitching software helps but invariably introduces distortion because of the changes in camera perspective. The best solution is to take the picture from well above ground level. Fortunately, the building enclosing the bone bed contains a remote-controlled crane that is used for bone and sediment removal and also serves as a mobile high-altitude digital camera mount. It is remotely controlled from a Panasonic CF-30 Toughbook laptop via a USB connection. Once pictures have been taken, it is time to use the Trimble 5600 Robotic Total Station for Surveying to collect coordinate information. The bone itself is never touched. The anchor points (washers) that were placed around the bone are shot and the coordinates stored in the Trimble's memory. Making a Perfect Map
The tracing is checked using Adobe Photoshop. The map is overlaid on the bone photograph. The individual polylines that make up the shapefile are merged, and the shapefile is appended to the Remap08 layer of the map. The photograph of the bone is adjusted to scale and printed so it can be manually digitized. Touching the digitizer's pen tip to each of the anchor points in the photograph determines the digitizer coordinates for each anchor point. The coordinates captured by the Trimble for the anchor points are assigned to the anchor points digitized in ArcMap. A polyline shapefile is created in ArcCatalog with the same bone bed number as the specimen being mapped. Next, the shapefile is opened for editing in ArcMap. By tracing over the bone with the digitizer pen, an accurate rendering of the bone appears in the appropriate place on the map. Next, the layer is opened for editing. The ancillary data collected about the bone during excavation is then added. Descriptive information, such as taxon, skeletal element, and completeness, is recorded as well as spatial information (e.g., elevation, azimuth, and inclination). The program even records the name of the discoverer and comments made about the bone during excavation. There are 30 fields in the attribute table for Remap08. This information lets researchers parse the data in many different ways for easier analysis of questions such as
These questions may be answered when the remap project has been completed. For more information, contact Donald Anton Esker |