ArcUser Online
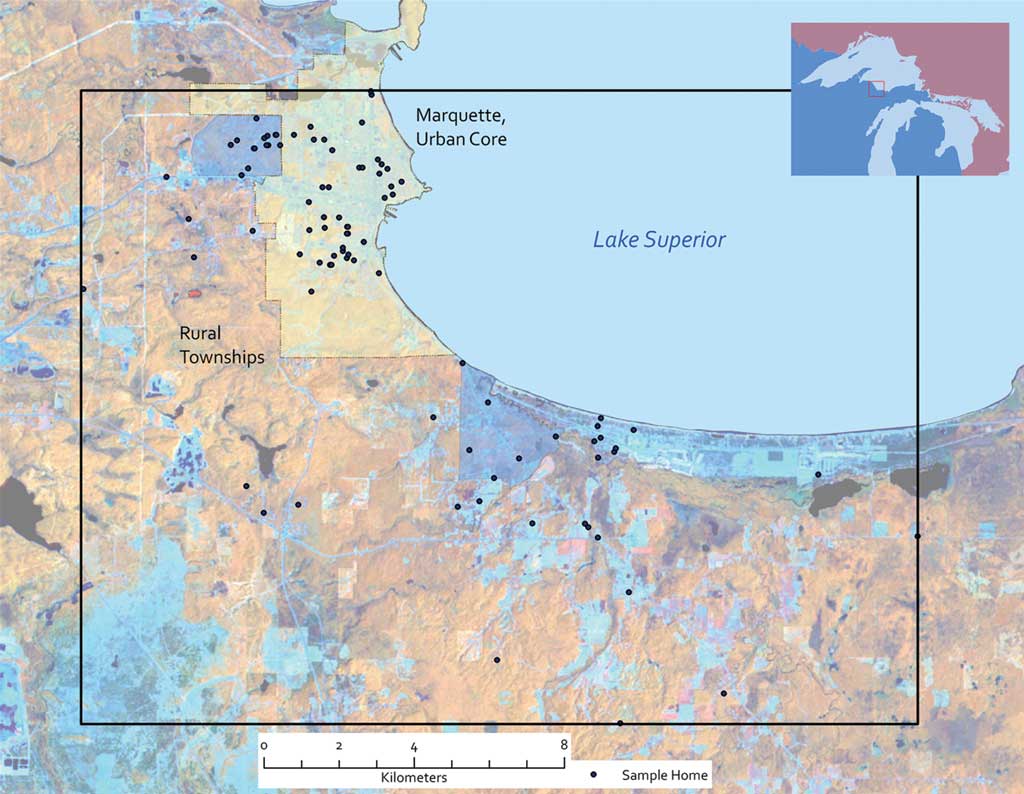
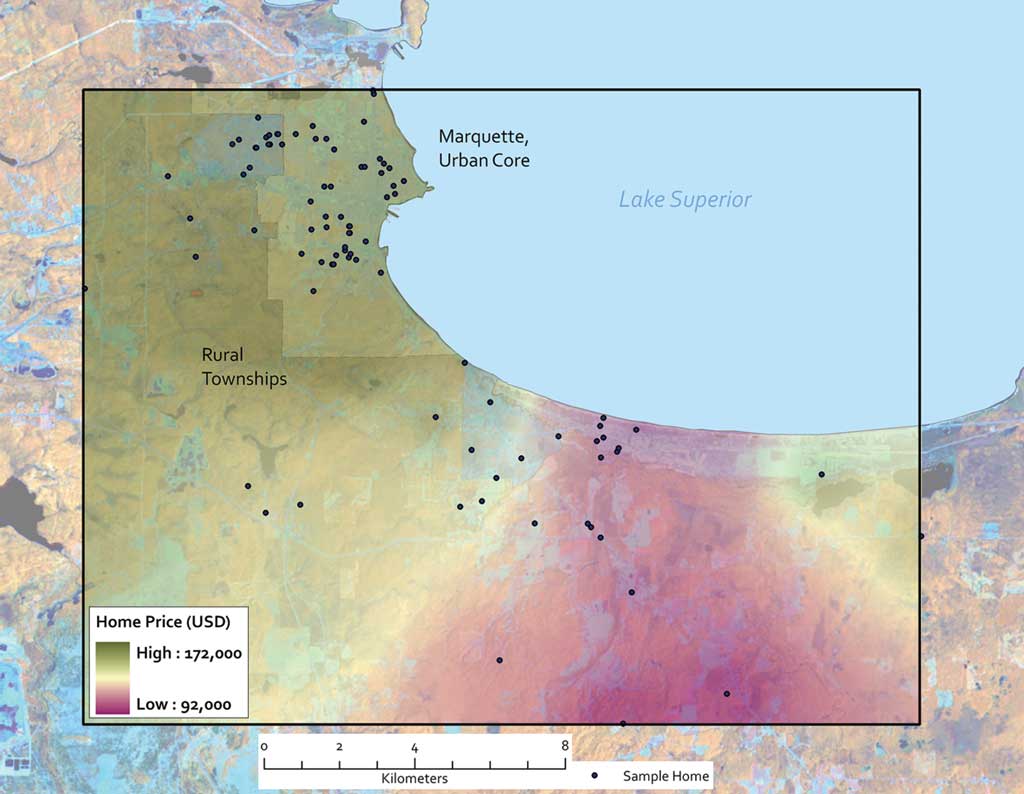
Underpinning geographic thinking is the assumption that spatial phenomena will vary across a landscape. Regression-based models largely ignore this assumption, much to the detriment of spatially varying relationships. However, ArcGIS 9.3 provides an exciting tool that generates spatially calibrated regression models. Known as Geographically Weighted Regression (GWR), this tool generates a separate regression equation for every feature analyzed in a sample dataset as a means to address spatial variation. (The GWR tool requires an ArcInfo, ArcGIS Spatial Analyst, or ArcGIS Geostatistical Analyst license.) To illustrate these concepts, students in a spatial analysis class at Northern Michigan University (NMU) analyzed the listed sales price for single family houses in Marquette, Michigan, based on location and several other related variables. Prior to the availability of the GWR tool, linear regression was applied to generate these models. Frequently, students found linear models to be limited because they would often overestimate the asking prices in some neighborhoods while underestimating prices in other neighborhoods. Applying the GWR tool was a way to improve modeling accuracy and ameliorate some of these residual errors. ApplicationTo calibrate this study, a sample of 93 homes listed on www.uprealestate.com in March 2008 was used. The coordinates for these houses were recorded in Universal Transverse Mercator (UTM) in North American Datum of 1983 (NAD83) Zone 16N. The listing price parameters included number of bedrooms and bathrooms, house square footage, and lot size. Because the number of bedrooms is closely linked with the square footage of the house, the number of bedrooms was excluded from further analysis. Initial linear regression analysis (entry method) was used for generating a global model predicting the listing price of homes in Marquette, Michigan. Using the GWR tool [found in the Modeling Spatial Relationships toolset in the Spatial Statistics tools in ArcToolbox], a spatially calibrated model was generated using the same dataset. The GWR tool gave separate regression coefficients for each of the 93 houses in the sample. These coefficients were mapped as raster surfaces, and the listing price of a common home (1,500-square-foot floor area with 1.5 bathrooms on a 38,400-square-foot lot) according to spatially varying regression coefficients was generated using the GWR tool in ArcGIS. ResultsWhile the linear regression model was found to be signifi cant and had a strong R-squared value of 0.782 (p = 0.000), the GWR model improved on these statistics and increased the model's accuracy to an R-squared value of 0.865 (p = 0.000). [R-squared is a measure of goodness of fi t. Its value varies from 0.0 to 1.0. Higher values are preferable. See the accompanying article, "Regression Analysis Components—Terms and basic concepts" for more information on these terms.] In addition, the range in residual value error decreased by $160,000 when using the GWR model instead of the linear model. The coefficient surfaces generated using the GWR tool were also helpful for identifying the spatial patterns apparent in the study area. For example, the lot value coefficients indicate that as lots are located nearer the urban core and farther from the rural townships, lot square footage price increases. In contrast, coefficients suggest that the larger the house, the less it contributes to the listing price (again, as properties are located nearer the urban core and farther from the rural townships).
This pattern may be indicative of the age of houses in rural areas. Sprawling rural subdivisions tend to have newer houses than neighborhoods in the urban core, yet land values are lower. These newer houses command a higher listing price per square foot according to the data analyzed. This pattern may also indicate a response to differences in millage rates between the townships and urban core. [Millage is the tax rate on property expressed in mills per dollar of value of the property.] Taxation rates in the urban core are typically twice as high as rates in rural townships in the state of Michigan (according to the Michigan Department of the Treasury in 2008). Higher millage rates may discourage the construction of newer developments in the urban core. In conclusion, the user-friendly GWR tool offers a sophisticated basis to quantify and dissect spatial patterns across a study area. Application of GWR offers a noticeable improvement over linear regression and helps to promote spatial thinking in students enrolled in courses at NMU. For more information, contact Robert Legg in the Department of Geography at Northern Michigan University (rlegg@nmu.edu). About the AuthorsRobert Legg (rlegg@nmu.edu) is an assistant professor at Northern Michigan University. He specializes in spatial data modeling, remote sensing, and cartography. Legg received his master's degree in remote sensing from the University of Aberdeen, Scotland and doctorate in geography from Trinity College in Dublin, Ireland. Tia Bowe (tbowe@nmu.edu) is a professional cartographer majoring in GIS at Northern Michigan University. Currently, she holds an associate's degree in geographic information systems from Hocking College in Nelsonville, Ohio. BibliographyFotheringham, A. Stewart, Chris Brunsdon, and Martin Charlton. Geographically Weighted Regression: The Analysis of Spatially Varying Relationships, Wiley. Chichester, United Kingdom, 2002. Michigan Center for Geographic Data. Spatial data retrieved March 2008. Michigan Department of the Treasury, http://www.mcgi.state.mi.us/mgdl/, (data collected October 2008). Mitchell, Andrew. The Esri Guide to GIS Analysis, Volume 2: Spatial Measurements and Statistics, Esri Press. Redlands, California, 2008. Rogerson, Peter A. Statistical Methods for Geographers:A Student's Guide, SAGE Publications. Los Angeles, California, 2006. |