ArcUser Online
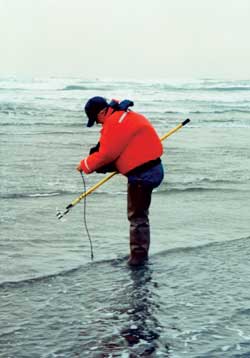
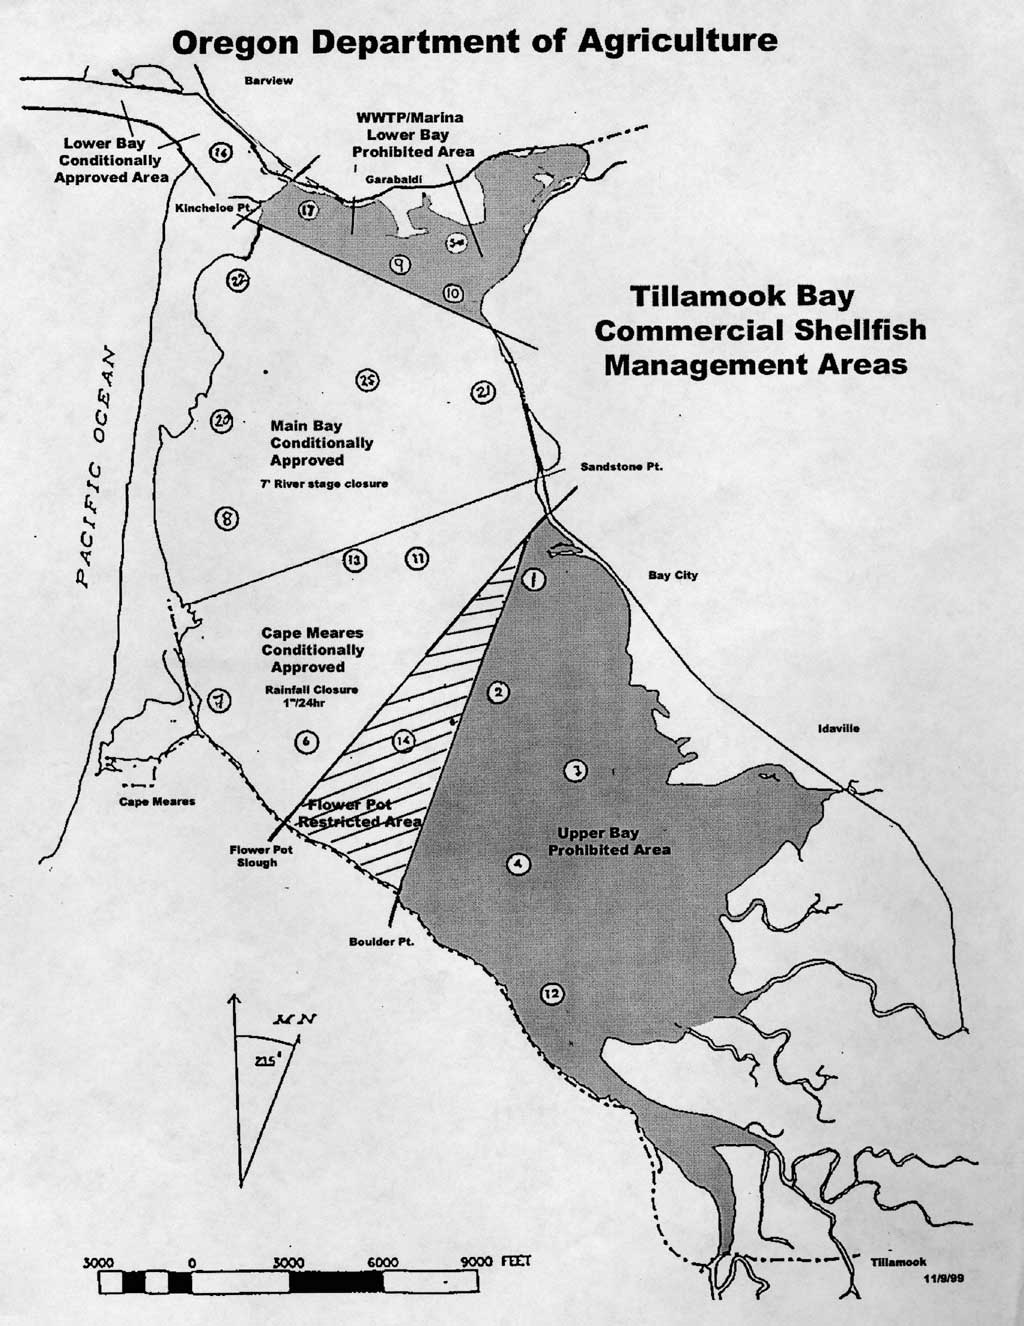
Editor's note: In summer, sunny weather and favorable tides bring Oregonians to the seashore in numbers to harvest shellfish--a popular recreational activity. Summer months can also bring higher levels of the harmful bacteria and toxins that cause shellfish poisoning. Warmer water causes toxic algae blooms where clams, mussels, oysters, and other shellfish feed. Several human illnesses are caused by eating shellfish that have ingested toxic algae. These illnesses range from diarrhetic shellfish poisoning, which causes gastrointestinal upsets, to amnesic shellfish poisoning, which causes neurological and gastrological disorders and can be life-threatening. In 2001, ODA's Food Safety Division began using GIS for mapping in the Shellfish Program. This program requires monthly water quality samples from nearly 200 sites located in eight different bays and beaches along the Oregon coast. To ensure the safety of Oregon shellfish, the program also samples mussels, oysters, and clams for shellfish toxins at almost 30 different coastal sites. The National Shellfish Sanitation Program (NSSP) requires the State to maintain a current and comprehensive list of all growing areas, including maps showing the boundaries and classifications of each shellstock growing area. [NSSP, a program for preventing human illness associated with the consumption of shellfish, promotes sanitary control measures for all phases of shellfish handling. The United States Food and Drug Administration (FDA) coordinates and administers NSSP, and federal and state agencies and representatives of the shellfish industry participate in it.]
In the past, the Food Safety Division scanned maps from the National Oceanic and Atmospheric Administration (NOAA) or the United States Geological Survey (USGS) and created image files using Adobe Photoshop. These images were used in estimating the locations of sample sites on shellfish management area maps. However, these maps raised questions about appropriate sample stations in relation to the boundaries of classified shellfish growing areas. The Shellfish Program contracted with Diana Walker, GIS coordinator for the Natural Resources Division of ODA, to create accurate and detailed maps depicting the sample locations and classifications of shellfish growing areas. To accomplish this, several GPS units designed for use in a marine environment were purchased. The units can use NOAA charts as basemaps instead of land-based system references. The ability to use NOAA charts was an advantage because many sample stations were located at navigational aids [i.e., the buoys, beacons, and other devices used for orientation] included on the charts. Field staff began collecting latitude and longitude coordinates at water and biotoxin sampling locations as well as the growing area boundaries described in bay area management plans. The coordinate data, initially entered into a Filemaker Pro database, was exported into ArcView 3.2.
Using ArcView 3.2; Nautical Chart Viewer, an extension created by NOAA (available for both ArcView 3.x and ArcGIS); and Chart Navigator software from Esri business partner MAPTECH, Walker created an event layer she used for accurately placing water sampling sites and growing area boundaries. She used NOAA charts for most areas and USGS digital raster graphics (DRGs) [georeferenced scanned images of USGS standard series topographic maps] for estuaries. Once this was done, the Shellfish Program staff were able to evaluate sampling locations and compliance with NSSP requirements by using the coordinates taken at landmarks and navigational markers to map the location of growing area boundaries. The FDA, the agency overseeing state shellfish programs, complimented Oregon on these GIS-generated maps saying that they are more accurate and detailed. The maps are also great for communicating new or changing shellfish management areas to harvesters, growers, and other state agencies. Future plans include having all growing and harvest areas and biotoxin collection sites mapped using the GIS technology and linking water quality and biotoxin databases to the sampling sites. Having the boundaries of the shellfish management areas described in ArcView will allow the Shellfish Program to determine if prohibited zones provide adequate dilution volume for discharges from marinas and wastewater treatment outfalls. For more information on the Shellfish Program, visit the Web pages for the ODA Web site at www.oda.state.or.us. For more information on the use of GIS in ODA's Shellfish Program, contact Diana L. Walker, GIS Coordinator |