ArcUser Online
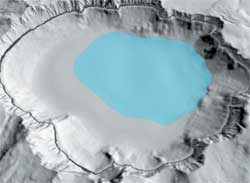
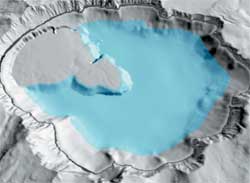
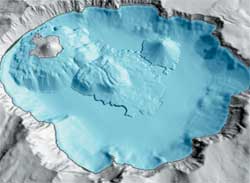
Lake Filling and Geologic HistoriesArmed with the knowledge that lake level had remained relatively constant for some time and with the new GIS calculations for the volume of water in the lake, USGS scientist Manuel Nathenson calculated a hydrologic lake filling history for Crater Lake. These calculations were based on lowered precipitation rates subsequent to filling having caused the submerged beaches. Defining the lake filling history was a major step in unraveling the geologic history of Crater Lake. Knowing where the lake level was at a given time helps date the eruptions and landslides on the lake floor. Ancient shorelines, where lava flows contacted the water's surface on two of the volcanoes located on the lake floor, indicate that—for at least part of their lives—they were erupting above the water line. Knowing when the water line was at the level of an ancient shoreline helps date these eruptions. Two of the volcanoes on the lake floor also appear to have erupted entirely under water (i.e., all activity occured while these features were submerged). This information helps date their formation. Underwater landslides can be dated in a similar manner. The geologic history was illustrated through a series of GIS perspective views that showed the young caldera approximately 7,700 years ago, new volcanism underway just 80 years later, the end of volcanism approximately 4,900 years ago, and the later landslides that carried sediment into the lake. ConclusionUsing GIS to visualize and analyze the depths of Crater Lake was extraordinarily successful in revealing its geology, geomorphology, and geologic history. GIS brought together information generated by a group of scientists with diverse backgrounds. Virtual flights around the various images of the underwater environment created using GIS have led to many new and exciting discoveries about one of the earth's most spectacular lakes. For more information, contact David W. Ramsey, Geologist/GIS Specialist Continuing WorkGIS visualization of the geology of Crater Lake continues. Charles R. Bacon is compiling the "Geologic Map of Mount Mazama and Crater Lake Caldera, Oregon." When completed, this unique map and digital database will provide continuous geologic coverage of Crater Lake and the former Mount Mazama—both above and below the water line. GIS visualization is also being employed in public lectures about the lake and in posters, fact sheets, and other outreach presentations. References2000 Multibeam Sonar Survey of Crater Lake, Oregon; Data, GIS, Images, and Movies at geopubs.wr.usgs.gov/dds/dds-72 Crater Lake Revealed at geopubs.wr.usgs.gov/i-map/i2790 About the AuthorsDavid W. Ramsey is a geologist and GIS specialist for the USGS Volcano Hazards team in Menlo Park, California. He earned a bachelor's degree in geology from Mount Union College and a master's degree in geology from Bowling Green State University. Joel E. Robinson is a geologist and GIS specialist for the USGS Volcano Hazards team in Menlo Park, California. He earned both a bachelor's and a master's degree in geology from Miami University. Peter Dartnell is the project leader for the Pacific Seafloor Mapping Project of the USGS Coastal and Marine Geology team in Menlo Park, California. He earned a bachelor's degree in oceanography from Humboldt State University and a master's degree in environmental studies resource management from San Francisco State University. |