ArcUser Online
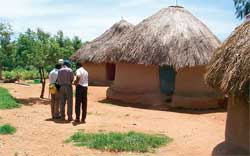
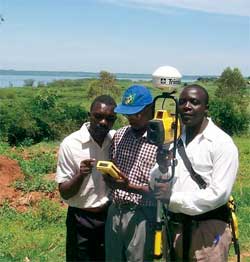
International organizations that provide aid to poor, sick, and vulnerable people in underdeveloped nations often struggle with a serious ethical question. In a world in which resources are insufficient to help everyone, will assistance given to one group negatively impact other groups? This was the dilemma faced by public health researchers working in Africa during the late 1990s. A major program had been proposed to test the effectiveness of insecticide-treated bed nets in reducing the incidence of malaria, especially among children. Although the impetus for the program was developing strategies for efficient distribution of the limited bed net supplies, the chief concern of researchers was whether people who didn't receive nets would suffer because their neighbors did receive bed nets. Epidemiologists hypothesized that malaria carrying mosquitoes, unable to feed on people protected by the nets, might swarm in greater numbers at nearby homes lacking nets. Ultimately, this question and several others were answered—with surprising results—through spatial analysis of bed net distribution patterns and malaria infection rates in Kenya. The area was mapped using GPS and GIS technology. "We had to make sure that bed nets did not merely redistribute malaria cases throughout a community," said Bill Hawley, biologist with the Centers for Disease Control and Prevention (CDC) in Atlanta. "Without GPS mapping and GIS analysis, this project would have been impossible." Dying of MalariaMalaria kills between one and two million children under the age of five every year in Africa. Nearly all of the infectious bites come from three mosquito species that feed on blood between 11 p.m. and 3 a.m. In equatorial Africa, most houses have open doors and windows. People asleep in their beds are easy prey. However, this predictable feeding pattern also was advantageous in developing preventive measures because both the timing and setting of infectious bites were known. Permethrin is an insecticide that is harmful to mosquitoes but safe for humans. Draping permethrin-treated nets around beds was a practical solution. But before the nets could be widely distributed, international aid organizations wanted evidence that bed nets were effective in reducing malarial infection, mortality, and morbidity and that neighboring areas without nets would not experience corresponding increases in these effects. CDC believed this type of statistical and spatial analysis could only be conducted in the GIS environment and spearheaded the effort to track and map the results of a pilot bed net study in Kenya. Two adjacent sites near Lake Victoria, Asembo and Gem, were selected because both had high rates of malarial infection. Covering roughly 500 square kilometers, the study area included 125,000 people living in 200 villages. Each village is comprised of multihouse compounds occupied by extended families. In 1998, CDC initiated the pilot study at an existing field station in the village of Kisian. Here, ArcView was used to build a GIS of the study areas of Asembo and Gem. The only usable maps available had been created in the late 1960s at 1:50,000 scale. This meant Asembo and Gem would have to be mapped on foot using GPS receivers. The accuracy of this field mapping was crucial to the project's success because the analysis of bed net distribution and human infection rates would be conducted at the individual house level. "Prior to the study, the majority of the scientists, including myself, were rather skeptical about the use of GIS mapping," said Feiko ter Kuile, a project participant and clinical epidemiologist at the Liverpool School of Tropical Medicine in the United Kingdom. "I don't think any of us appreciated that the ability to map each household was going to be so beneficial years later in the analysis phase." Mapping from ScratchCDC and participating researchers trained mapping teams in the use of GPS receivers and handheld data collection devices. These teams were mostly composed of Kenyans with no background in GPS or mapping. CDC purchased four Trimble Pathfinder Pro XRS GPS receivers with Trimble TDC1 Dataloggers. [TDC1s are handheld computers.] Trimble Pathfinder Office software was loaded onto a PC at the Kisian station, and feature collection dictionaries and menus were created and uploaded to the TDC1s for field use. When the project began, commercial GPS reception was still being degraded by Selective Availability to an accuracy of 100 meters. Because the houses to be mapped were relatively small and spaced just a meter or so apart, differential correction was required. CDC dedicated one Pro XRS to base station duty in Kisian. Unfortunately, no known survey markers were located nearby to provide a reliable control, so CDC researchers averaged one month's worth of nondifferential readings at the site and used the result at the base station location. The teams mapped one village per day focusing on the collection of location and attribute data for features relating to malaria and other health studies. Key map features included houses, compounds, villages, roads, livestock pens, water sources, medical facilities, and the Lake Victoria shoreline. Villages and compounds were identified by numbers and houses by letters marked on the structures and recorded in the data collector. Mapping teams used pull-down menus on data collector screens to enter attributes of features such as the number and ages of each house's occupants and the codes used to identify occupants by their positions in the family.
House mapping was greatly accelerated by an Advantage GPS mapping laser from Laser Atlanta of Norcross, Georgia. The laser was linked by split serial cable to the GPS receiver and the data collector. This enabled a field crew member to stand in the middle of a compound and remotely record the location of each house by firing the laser. The laser calculated the offset distance from the crew to the house, which was then automatically corrected by the GPS to determine the precise coordinates of the structure. Continued on page 2 |