ArcUser Online
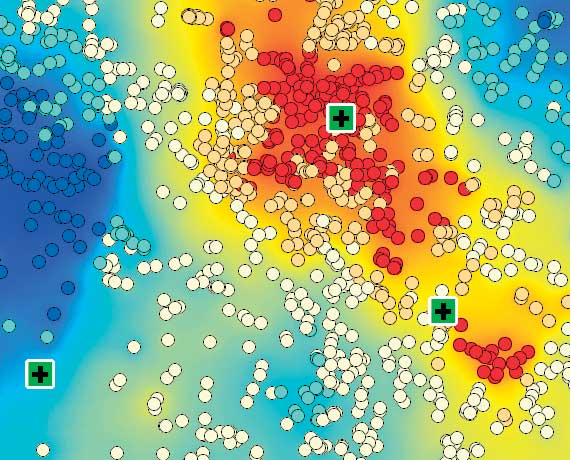
When crime distributions are compared to other features in the landscape, similarities or relationships often become apparent. The most common way for measuring the trend for points or areas is to calculate the standard distance separately in the x and y directions. These two measures define the axes of an ellipse encompassing the distribution of features. The ellipse is referred to as the standard deviational ellipse since the method calculates the standard deviation of the x-coordinates and y-coordinates from the mean center to define the axes of the ellipse. This ellipse shows if the distribution of features is elongated, which indicates it has a particular orientation. For example, crime events grouped by police beat and evaluated using the Standard Deviational Ellipse tool may show that, for some police beats, crime activities are evenly distributed throughout the beat so the ellipse resembles a circle. In other cases, crime activities tend to follow road networks, and crime incidents in these police beats show that orientation. ConclusionBy placing crime incidents in a geographic context and applying the spatial statistical analysis tools now available in ArcGIS 9, crime analysts can better understand where and why crime activity is occurring and law enforcement agencies can respond in the most efficient and effective manner. Additional ResourcesNot only crime analysts but also GIS practitioners in many research areas, such as epidemiology, archaeology, wildlife biology, and retail analysis, will benefit from the spatial statistics tools in ArcGIS 9. These tools can be easily modified or extended because most were written using the Python scripting language. The source code for the statistical tools can be accessed from ArcToolbox and serve as samples and templates for further customization. For more information about scripting in the ArcGIS geoprocessing environment, select Geoprocessing >Writing Geoprocessing Scripts on the Contents tab of the ArcGIS 9 Online Help.
The Esri Guide to GIS Analysis, Volume 2, an Esri Press book scheduled for release in the third quarter of 2005, provides additional specific information on spatial statistics tools and more general information on spatial data analysis using GIS. It is the second in a series by Andy Mitchell. The first book, The Esri Guide to GIS Analysis, Volume 1, focuses on visual and cartographic methods of spatial data analysis. Both books can be purchased online at www.esri.com/shop. Online resources are also available. A five-minute video showing hot spot analysis of emergency 911 call data is available on the Esri Web site. An article describing the tools in the Spatial Statistics toolbox appeared in the October–December 2004 issue of ArcUser and is available online. For more information on the Python scripting language, visit www.Python.org. About the AuthorsDr. Lauren Scott works on the ArcGIS Geoprocessing Team and developed the tools in the Spatial Statistics toolbox. She holds a Ph.D. in geography from the joint doctoral program at San Diego State University in California and the University of California, Santa Barbara. Nathan Warmerdam works as a product specialist on the Geoprocessing Team. He holds a master's degree in geographic information science from the University of Redlands in California. |