ArcUser Online
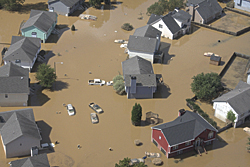
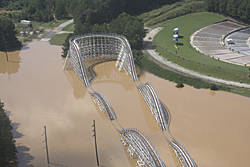
This article as a PDF . In September 2009, torrential rains in the northern portion of Georgia caused excessive runoff, triggering massive flooding in several areas. Flooding principally affected Cobb, Fulton, and Douglas counties and caused nine deaths and approximately $250 million in property damage. Cobb County, in northern Georgia, with a population of approximately 700,000, experienced heavy flooding along the banks of Chattahoochee River and various major creeks. Hundreds of houses and families in southern and southeastern Cobb County were affected. County and federal governments and relief organizations played an important role in rehabilitating affected areas by providing emergency response, shelter, and postdisaster support. Part of that support came in the form of geospatial modeling within an enterprise GIS environment. Established in 1999, Cobb County's enterprise GIS was an integral part of the county's Emergency Operations Center (EOC). At the EOC, GIS staff collected data from damage assessment teams and staff members supporting the center, created data layers, performed analyses, and produced maps in response to several requests for information.
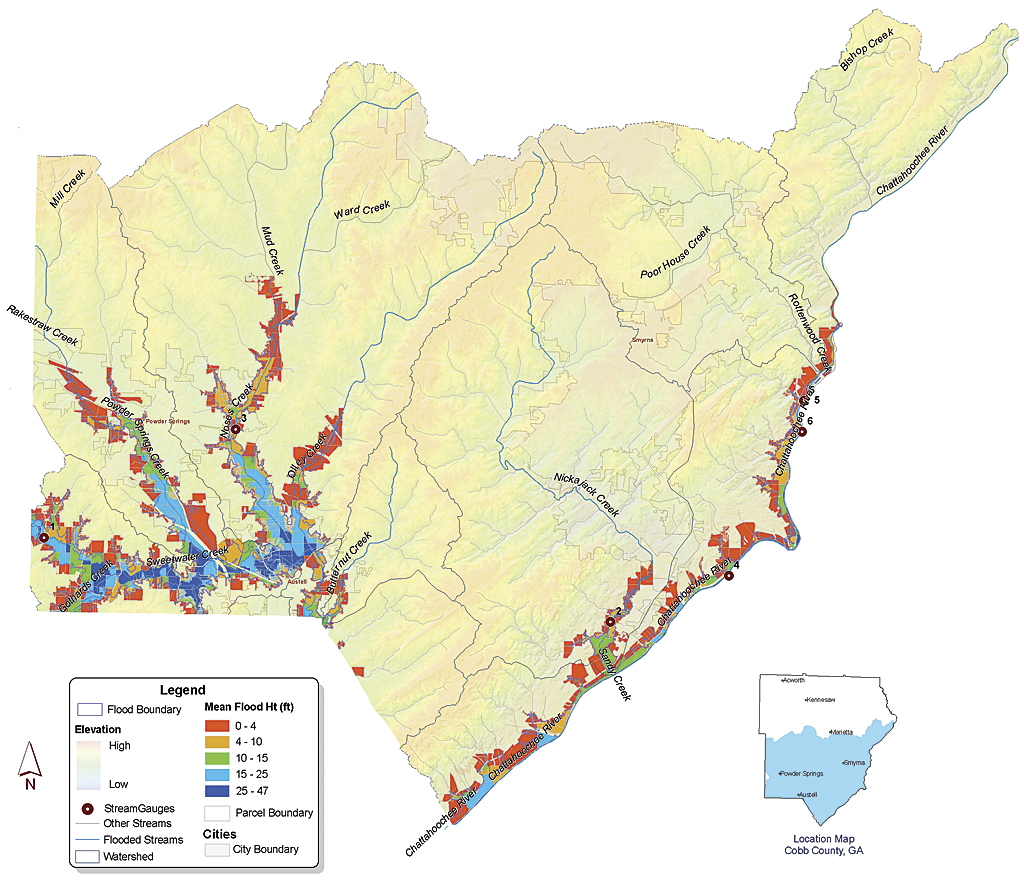
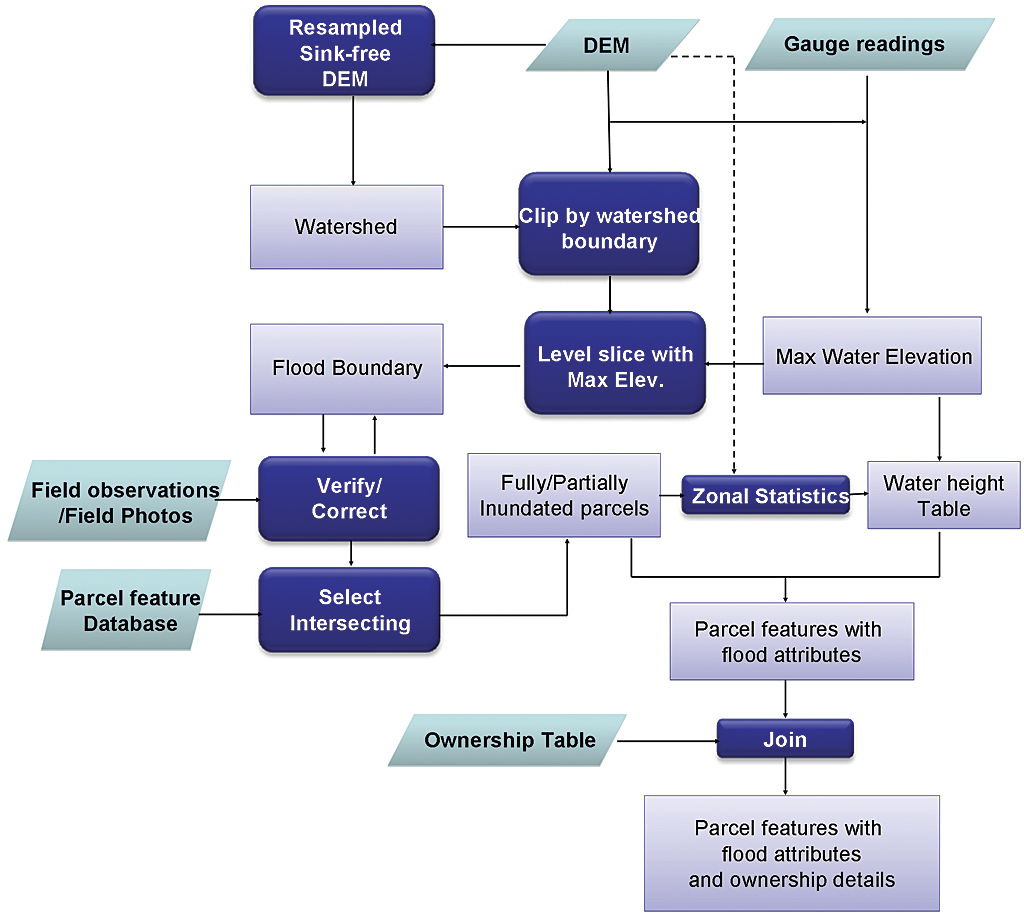
Away from the EOC, GIS staff in different departments coordinated with the EOC to create data layers and produce maps, such as the road closure maps generated by Cobb County Department of Transportation. To focus immediate assistance where needed most, identification of the flood-affected properties was important. Flood analysis carried out by the GIS group and the tax assessor's office benefited different departments that were working to provide a fast and effective response and mitigation after the event. The flood inundation analysis was carried out with stream gauge measurements from the United States Geological Survey (USGS) and spatial data contained in the county's enterprise GIS. The main objectives of the analysis were to identify the approximate extent of floodwater coverage; identify and locate the affected parcels; determine the minimum, maximum, and mean water heights in the parcels; and identify and document completely and partially flooded properties. The analysis used three data sources: maximum stream gauge readings at select locations, a high-resolution elevation surface derived from the county's digital terrain model (DTM), and the parcel database. All vector and raster data analyses were carried out in ArcGIS Desktop because it has the vector, raster, and three-dimensional capabilities needed to complete the analysis. Apart from the routine analysis, the hydrologic analysis tools helped in the faster delineation of watersheds, whereas the 3D capabilities helped in visualizing the output. Determining the Flood BoundaryDeriving the flood boundary as fast as possible was the main goal of the EOC request. Necessary modifications were made to the flood boundary using the field observations. The corrected flood boundary was then used to identify inundated parcels.
Stream gauges served as the primary source of water level information during the flood event. Readings from seven gauges located on various streams/rivers were used to determine the elevation of floodwater at these locations. The crux of any terrain-based analysis is a three-dimensional representation of the terrain. Hence the accuracy of the output is highly dependent on the terrain model. A highly accurate digital elevation model (DEM) with a horizontal resolution of 8 feet, which was derived from the county's 2-foot contours and stored as a float double-formatted raster image, is available from the county's enterprise GIS data warehouse. To verify the flood boundary and make corrections during field verification, the original 2-foot contour data was used. A line feature class of the streams was used to identify the stream centerlines and names. Orthophotos and oblique aerial photography were used in conjunction with photographs taken from aircraft to verify the flood boundary and the floodwater heights at known locations. The county maintains a parcel geodatabase in ArcSDE as well as tables in a CAMA (computer-assisted mass appraisal) system that contains ownership, property classification, and valuation information for more than 248,000 parcels. Each record in the parcel geodatabase and CAMA table is identified by a unique parcel number, which was used to link these tables to obtain the ownership and property class information. Calculating the Flood Extent
Runoff water from a hydrologic unit (watershed) is always drained to a particular stream. Thus, the stream floods the area within its watershed. The flooded areas in the county were divided into six watersheds for flood boundary calculation. Watershed boundaries were derived from a resampled (32-foot) sink-free DEM using the Hydrology tools in the ArcGIS Spatial Analyst extension. U.S. Geological Survey stream gauge sites were visually identified from the orthophotos. The ground elevation (m-values measured in feet) at these locations were obtained from the DEM. The flood boundary was calculated by determining the maximum flood elevation in feet (H) for a watershed, then identifying the areas in the DEM having values less than H. The maximum flood elevation is calculated as where SG is the maximum stream gauge reading in feet. H = M + SG Inundation areas were calculated separately for each watershed. The DEM grid (8-foot resolution) clipped by watershed boundary, was level sliced to identify the area below the maximum flood elevation. The flood cover raster was then converted to a polygon feature to obtain the flood boundary. For generating the preliminary flood boundary, slope of the streams was not taken into account. Modifications were made to the flood boundary using observations from the field. Flood boundaries from all the watersheds were then combined into a single polygon.
The flood-affected parcels were identified by intersecting the flood boundary with the parcel feature layer. Parcels completely falling within the flood boundary were classified as fully inundated. The minimum, mean, and maximum floodwater heights for each parcel were calculated by estimating the respective elevations from the DEM (using the zonal statistics tool), according to the following formulas. Hmin = 0 or H - Mmin if H > Mmin Hmean = 0 or H - Mmean if H > Mmean Hmax = 0 or H - Mmax if H > Mmax Where Hmin, Hmean, and Hmax are the minimum, mean, and maximum water heights and Mmin, Mmean, and Mmax are the minimum, mean, and maximum ground elevation values, respectively. The formulas above are used for calculating floodwater heights for each parcel.
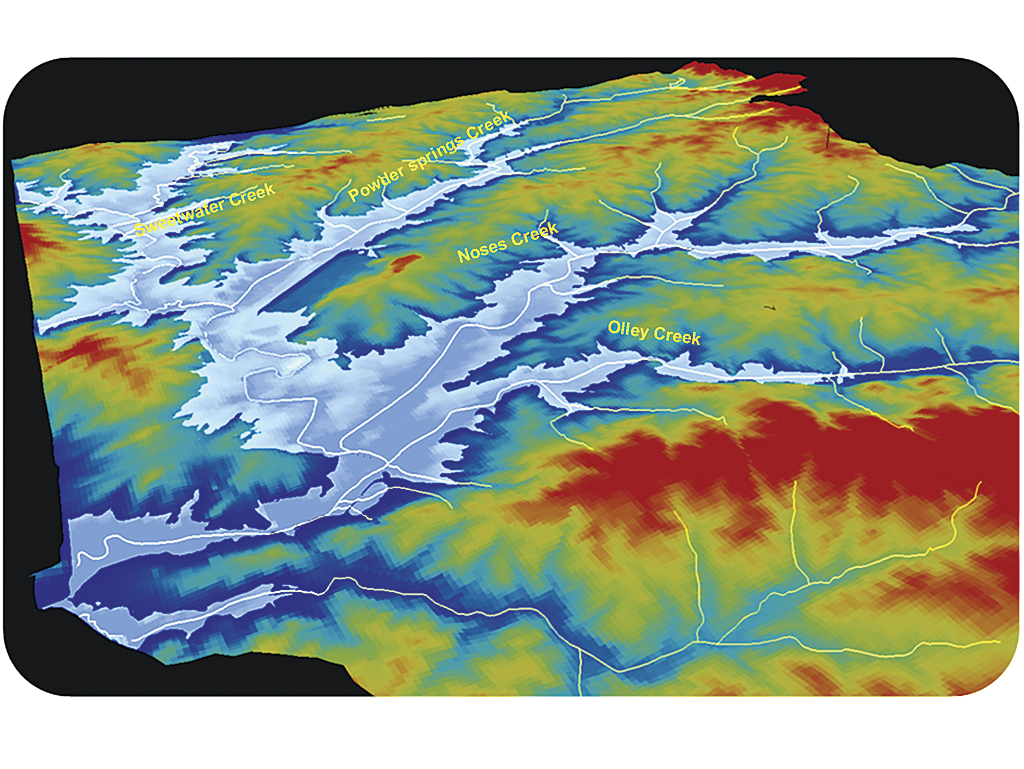
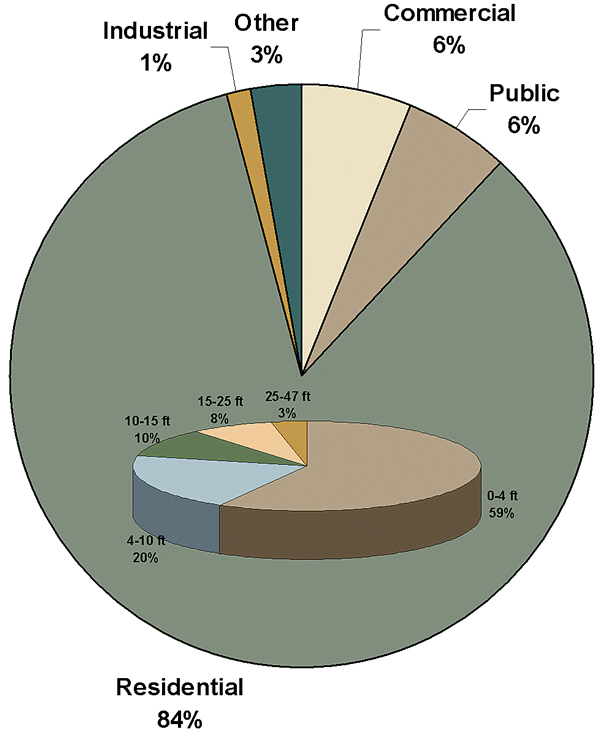
The parcel feature table was then joined with the ownership table to obtain the parcel class (e.g., commercial, residential, public property). ArcScene was used to generate a three-dimensional visualization of the flooded area. The field inspectors were provided with situs addresses along with the flood height information for the parcels. This information helped them easily identify and determine the extent of damage for each property. The county has since established a river model in HEC-RAS to help ensure future flood inundation boundaries can be obtained with better accuracy. [HEC-RAS, or the Hydrologic Engineering Center's River Analysis System, is a software program developed by the U.S. Army Corps of Engineers for performing one-dimensional steady flow, unsteady flow, sediment transport/mobile bed computations, and water temperature modeling.] Information is the lifeline of any EOC, and GIS technology is a valuable tool when it comes to managing and analyzing data and ensuring its broad availability. Through the use of GIS, Cobb County was able to quickly determine the approximate extent of flooding; generate maps and reports that helped first responders, inspectors, and repair crews prioritize the areas to visit; and publish information to department managers and personnel via a Web mapping application. For more information, contact Tim Scharff, GISP, GIS Manager, at tim.scharff@cobbcounty.org |