|
Editor's Note: The author has developed four tools for ArcInfo that can be used to create all the components necessary
for three-dimensional flight animation. These tools make the process simple and even fun. They may be used as stand-alone
tools, or they can be used in sequence with the output from one application serving as the input for the next application to
create flight animation.
GIS has become both practical and enjoyable. Technological advances provide tools that make data processing more efficient
and user-friendly. Data can now be displayed in more meaningful and visually appealing ways that can improve decision making.
Data sources are more abundant today than even a few years ago. Not only the quantity but the quality of digital data has also
improved. More accurate and precise data is available.
In some situations, however, you may need or want to generate your own data. Sometimes the desired data does not exist
or is too expensive and creating a substitute will adequately serve the needs of your project. In any event, you want the final
result to look appealing in addition to effectively displaying the data. The four tools described in this article will help you do
just that.
What You Will Need
All the tools require an ArcInfo license and a copy of Visual Basic (VB) 5. These tools are stand-alone applications so you
do not need to be running an ArcInfo session to use them but you will need to have VB running. The basic functions of each
application are described below. For a more complete description of these tools, see the README file that is available for each one.
Click on the name of each of the flight animation tools listed below to download and learn how to use it.
Each tool is accompanied by a detailed README file
- ShadesetEditor
- Makes a customized continuous shadeset.
- ShadeImage
- Creates a 2.5-dimensional color surface using a selected shadeset.
- 3D Viewer
- Generates a three-dimensional view of a surface by rendering it on the 2.5-dimensional image created using ShadeImage.
- Flight_3D
- Records a flight animation in MPEG format.
Generate a Custom Continuous Shadeset
The ShadesetEditor tool generates a continuous shadeset of seven to 999 symbols. The ARCPLOT SHADECOLORRAMP
command is the key ArcInfo function behind this interface. To use ShadesetEditor, specify colors from the 129 available in
the ColorNames.shd file.
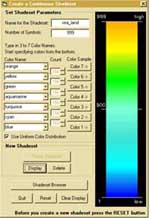 A minimum of three colors is required and a maximum of seven colors is allowed. Enter the color names
in the appropriate combo boxes by typing them in or by using the pull-down list. A sample of every selected color can be viewed.
The "distances," or the number of symbols between colors, are uniform by default but can be specified.
A minimum of three colors is required and a maximum of seven colors is allowed. Enter the color names
in the appropriate combo boxes by typing them in or by using the pull-down list. A sample of every selected color can be viewed.
The "distances," or the number of symbols between colors, are uniform by default but can be specified.
The shadeset builds from the bottom up, so shadeset color specifications must start from the three colors at the bottom of the Set
Shadeset Parameters section of the Create a Continuous Shadeset dialog. Only valid choices are enabled. As you make a color
selection, the option immediately above that selection becomes available. The newly created shadeset can be displayed and saved
or deleted. This tool can also be used to browse existing shadesets. Navigate to the directory where the shadeset files are stored
and select a file to display in the ShadesetEditor canvas window.
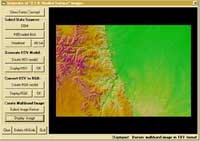
Create a 2.5-Dimensional Color Surface
Using the ShadeImage tool you can create a 2.5-dimensional color view if you have a surface
such as a digital elevation model (DEM), a hillside view, and a shadeset. A 2.5-dimensional view displays data in colors representing
the intensity of any phenomena, and the hillshaded effect emphasizes the variation of that intensity. A hillside is created by using
shades of gray to emphasize slopes and the variation in intensity of the data. Typically, though not necessarily, the surface is a DEM.
 A DEM may be displayed in colors customized for lowlands, highlands, and high mountains. The partial three-dimensional effect is
added by merging the hillshaded grid, which is derived from the DEM by running the HILLSHADE function of ARC GRID, with the
original surface grid (i.e., the DEM). In addition to displaying DEMs, this tool can be applied to all surfaces that can be qualified as
continuous such as population density, income level, precipitation, or soil moisture.
A DEM may be displayed in colors customized for lowlands, highlands, and high mountains. The partial three-dimensional effect is
added by merging the hillshaded grid, which is derived from the DEM by running the HILLSHADE function of ARC GRID, with the
original surface grid (i.e., the DEM). In addition to displaying DEMs, this tool can be applied to all surfaces that can be qualified as
continuous such as population density, income level, precipitation, or soil moisture.
In addition to the surface and hillshaded grids mentioned above, a continuous shadeset is required to produce the output image.
The ShadeImage tool provides 12 shadesets. Any of the five shadesets displayed in the ShadeImage window can be selected.
If these choices are not appropriate, use the shadeset browser to navigate to the directory holding the other shadeset files. Once
selected, the shadeset will be displayed in the ARC GRID canvas window. Additional custom shadeset files can be generated using
the ShadeEditor tool described previously. These tools work together so you can launch the ShadeImage tool from ShadeEditor
and your new shadeset will be automatically transferred and will display in ShadeImage.
To create a 2.5-dimensional color surface, put the hillshaded grid into the Value component of the Hue Saturation Value (HSV)
color model. This uses ARC GRID functionality and displays using the GRIDCOMPOSITE command. Since all multiband images
are made from red, green, and blue (RBG) components, the colors representing surface elevation and the shades of gray add the
impression of a third dimension to the display but must be transformed from the HSV to RGB color model.
The ShadeImage tool outputs a shaded image in BIL, BMP, BSQ, JFIF, SunRaster, or TIFF format as well as a grid composite.
Shaded color images have an added value that helps represent a DEM, or other black and white surface, in a more legible and
visually attractive fashion than standard plain grids or images that just show the surface. With the exception of JFIF and BIL formats,
the output images can be used as input for image rendering over a surface using the 3D Viewer tool described in the next section.
Images created with ShadeImage show interesting effects and in some cases can be used as a substitute for satellite images and
aerial photos.
Generate a Three-Dimensional View of a Surface
The 3D Viewer tool will allow you to transform a flat map into a three-dimensional view using the functionality of the ARC TIN
SurfaceScene commands.
The 3D Viewer tool requires projected surface data (e.g., DEM) in grid format and an image over which to render. This image
could be satellite data, a representation of a geological map, a scanned topographical quad map, or a 2.5-dimensional image
produced with the ShadeImage tool described previously. The surface data in grid format and the matching image must be in the
same projection and must overlap completely.
Use the mouse to specify the x, y position of the observer and the direction of the view on top of the displayed image.
The x and y coordinates in map units will be displayed just above the canvas window along with the current scale of the map.
A set of pan and zoom tools is available.
Many parameters can be set to obtain different visual effects when creating for a new three-dimensional view. These include
the photo realistic effects of sky color, distance to and height above the surface of fog, the distance to haze, the relative positioning
of the horizon on the view, and the tilt of the view.
Choose any reasonable combination of these parameters. Use the option for
setting the vertical exaggeration to evaluate some interesting visual effects.
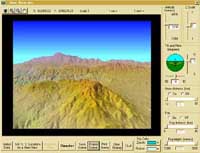 The application warns you if you mistakenly choose
an observation elevation under the DEM surface.
The application warns you if you mistakenly choose
an observation elevation under the DEM surface.
You can save any view displayed in the tool's canvas window, whether it is a three-dimensional view
or just displayed data, in one of several image formats including BMP, JFIF, TIFF, and
SunRaster. By the same token, a previously created view in one of the supported formats can be
displayed in the 3D Viewer window or sent to a printer.
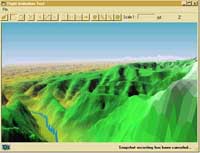
Record Your Own Flight Animation
Flight_3D facilitates the generation of a set of three-dimensional views. When these views or snapshots are displayed
chronologically, they simulate an air flight over a selected surface generating a user-directed flight animation movie.
The flight path can be designed on the displayed image, and vertical variation in the flight can be added. Using the user-designed
three-dimensional flight path, Flight_3D generates individual three-dimensional views at a constant distance interval. These images
are subsequently bundled together into one file.
 When displayed by an MPEG player at a speed of five to 12 frames per
second (depending on your machine's speed and the frame size), these images produce the illusion of continuous movement
over a surface, mimicking an airplane's flight.
When displayed by an MPEG player at a speed of five to 12 frames per
second (depending on your machine's speed and the frame size), these images produce the illusion of continuous movement
over a surface, mimicking an airplane's flight.
Two components need to be set for the flight path--the ground path or horizontal route and the vertical variation. To design
a smooth and effective ground path, specify a rounded and continuous line within the extent of the surface model data.
The ground path can be specified as a digitized line or as a circle. Flight 3_D offers a set of pan and zoom tools to make the
design of a precise ground flight path easier.
When the ground flight path is ready, it will be automatically splined to avoid abrupt changes in direction. While the ground
flight path is designed on top of the displayed surface, the vertical component may be added using a diagram showing a
cross-section of the terrain specified by the ground flight path and a line that represents the flight.
The additional flight parameters that can be controlled include
- Flight apparent speed (distances between snapshots)
- View tilt (vertical angle of the view relative to the horizon)
- View direction (horizontal direction of a view relative to the flight path)
- Z scale (surface vertical exaggeration)
Several options control the movie's final form. One of four image formats as well as standard small, standard large, or custom
frame sizes can be specified for output. The output MPEG file name and entire header page can be displayed at the beginning
of the movie as a movie title.
Flight_3D will check your system to determine whether there is enough space for all the movie frames. If it finds insufficient
room, it will give you an opportunity to change the destination directory from the default C:\TEMP directory to one you specify
or to remove files to create space. The process of creating movie snapshots is time-intensive and dependent on the speed of your
machine and the number of frames.
Rendering a large data set can be speeded significantly by reducing the size of the image to be draped. To avoid seeing the edge
of the data, which can occur when flying at high altitudes, diminish the edge by introducing the haze effect. The distance to haze
must be coordinated with the size, flight elevation, and the relief of the surface. After all parameters are set, the movie is created.
The user is notified when this process is complete. Starting the ArcInfo MPEG player will play the movie on the screen.
More Than Just Fun
The three-dimensional animation is not only for enjoyment, though an important reason it was created is that so many of us
simply love to watch these flybys. Three-dimensional animation can be used to analyze data from a different perspective, angle,
or altitude, revealing new characteristics of the data. This process can lead to better decisions in land use or road network planning
or in determining the position of a disputed watershed boundary in a remote area.
Requirements for Running These Tools
These tools were developed at the Esri Applications Prototype Lab, known as Benchmarks, using ArcInfo Version 7.2.1 ODE
with Visual Basic 5 exclusively on Windows NT. A hardware configuration (i.e., processor speed, RAM, etc.) sufficient to run
ArcInfo is all that is required to run these tools. For the best results, set the display resolution to 1,280 by 1,024 pixels and
32,768 colors. All these tools run successfully on laptop machines.
The Flight_3D tool requires a fast machine with a lot of memory and plenty of free disk space. A 500-frame animation in the standard
small size, the snapshot size supported by the MPEG player that comes with ArcInfo, generates snapshots 0.3 MB in size, requiring
approximately 180 MB of disk space of storage. Movies with larger frames need a more sophisticated MPEG player. A variety of these
MPEG players can be found on the Internet.
Disclaimer
The user assumes all responsibility for the selection of the sample routines as well as implementation of them to achieve the intended
results. The user is responsible for fully testing each portion of the routine prior to relying on it. This information is offered as a
sample only and Esri assumes no obligation for its operation, use, or any resultant effects in spite of this offer.
Acknowledgements
The author would like to express his gratitude to his colleagues Milosz Stasik, Liz Sarow, and Jian Zhou for their significant
contributions in the development of the tools described above.
|