|
Recent trends in government have emphasized streamlining operations to make them more cost-effective. This is especially true
in the area of health care. Community leaders searching for innovative methods of management have begun to recognize that
GIS is a powerful tool that can help them with management activities ranging from determining intervention strategies to
formulating health care reform. Through the geocoding process, GIS allows personal health data to be examined spatially so
that patterns can be discerned.
While geo-referencing personal health data can greatly enhance the decisions made by public health officials, it makes the
task of protecting residents' confidentiality more challenging. One solution to this dilemma is to aggregate personal identities
into groups so that data on individuals cannot be extracted.
The South Carolina Department of Health and Environmental Control (SCDHEC) chose this approach to managing georeferenced
vital health records. These records were geo-coded and aggregated at the census tract level. The Vital Health and Census Data
Integration System (VHCDIS), an ArcInfo-based GIS automation system, was developed to aggregate this data. An ArcView
GIS application, the Health Data Query System, provides easy access to the aggregated data. The primary objectives in creating
this system were to promote personal privacy, automate health data aggregation of georeferenced vital records data, and improve
national access to spatial health information.
For centuries, health researchers have been using spatial locations, boundaries, and regions to determine the quality, quantity, and
migration of epidemics. Overlaying quantitative graphics on a map enables the viewer to realize potential information in an extremely
clear manner. The famous 1854 London cholera study conducted by Dr. John Snow has been hailed as the geographic benchmark for
using maps in epidemiological studies.
Currently, the SCDHEC, Division of Biostatistics, presents spatial health information on the county level. County-level data
provides a wealth of information. However, data in this macro scale does not allow local health officials to adequately identify,
analyze, and monitor health problems at the community level.
In 1989 the Johnson Wood Foundation authorized a grant allowing the SCDHEC's Vital Record Geographic Referencing System
(VRGRS) and the University of South Carolina's School of Public Health (USCSPH) to study the feasibility of georeferencing vital
records data for the purpose of assisting public health assessments, surveillance, and health hazard evaluations at the community level.
There were three main objectives for the VRGRS program: to develop a program that would encode the residential location of births
and deaths and apply GIS as part of the State-wide vital records system, to demonstrate the use of address and other location data
with TIGER files from the federal census of 1990, and to design and document this process in way that would complement a statewide
geographic information system for economic development. The VRGRS project determined that processes, scientific techniques, and
data identified were suitable to implement an informal GIS program within the Division of Biostatistics. Consequently, in 1994 staff and
equipment were selected to create a program to systematically georeference vital health data and store it at the Office of Vital Records.
Georeferencing Health Data
Georeferencing allows health data to be examined in relation to its spatial distribution. The issue of confidentiality arises when the
geographic resolution of data is fine enough to identify fewer than four addresses. At this level, the data changes from being a
research tool to being a tool that can target and expose individuals (Alpert and Haynes, 1994). Avoiding the disclosure of data
on individuals, households, establishments, or primary sampling units, especially in public-use databases, is a concern of government
health agencies. Though confidentiality policies may vary among agencies, they must reflect the laws and regulations imposed on
personal data collection and dissemination activities (Croner et al., 1996). To date, there is no minimum national threshold standard
defining public or professional access to spatial reference public health data.
The Biostatistics GIS Lab focused on developing a State-wide health information system capable of satisfying the wide range of needs
of health researchers while promoting spatially referenced public health confidentiality standards. This system required a
system capable of converting large volumes of data with acceptable match rates. Geographic Data Technologies (GDT)
of Lebanon, New Hampshire, an Esri business partner, was chosen to provide geocoding services based on tests for quality, cost,
and turn around times.
Once the vital records health data was converted into individual points, the issue of confidentiality was solved by aggregating
the data to the 1990 census tracts. The census tracts were chosen because they contained a volume of socioeconomic data
could be combined with the aggregate vital records. For example, the mother's age extracted from the vital records could be stratified
into the same categorical breakout as the female population of the tracts, allowing for calculation of statistical rates. Census tracts
were also chosen because these geographic boundaries are updated once every decade.
Working with voluminous vital record files proved to be tedious and time-consuming. The process of generating public health data
from these records was streamlined with the development of the Vital Health and Census Data Integration System (VHCDIS). This
system was designed to accurately aggregate health data within census tracts, establish a national precedent for collecting health
data, and standardize data output while saving time and being flexible enough to be continuously improved.
VHCDIS offers national and local programs the ability to join aggregate vital records health data with existing socioeconomic census
data as a tool for developing surveillance and intervention strategies. The point data resulting from the geocoding process, which
is treated with all the confidentiality of paper certificate data, is stored on a magnetic device for future use in very high resolution
studies.
Acquiring Birth Data
In 1991, South Carolina began using a new microcomputer software, Electronic Birth Pages (EBP). This system allows data entry,
produces birth certificates, and collects newborn data for laboratory screening. The end product of the process is an Electronic
Birth Certificate (EBC).
In order to generate spatial information from these birth records, the residential address file is extracted from the mainframe data set.
Variables used in geocoding include ID number, residential street address,
 city, state, ZIP Code, and four-digit ZIP Code extension. The data is checked for completeness and accuracy.
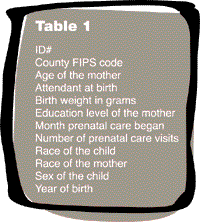
To complete the data set, attribute records are captured based on requests
made by health districts and the Division of Epidemiology. The attributes used are shown in Table 1.
city, state, ZIP Code, and four-digit ZIP Code extension. The data is checked for completeness and accuracy.
To complete the data set, attribute records are captured based on requests
made by health districts and the Division of Epidemiology. The attributes used are shown in Table 1.
Death Data Collection
Death data was collected from the death certificates filed by funeral homes. The funeral director or a person acting in that capacity
is responsible for completing the death certificate including personal information supplied by the family and medical information
The certificate is sent to the county health department to verify that it was correctly filled out. Acceptable certificates are forwarded
to the Office of Vital Records in SCDHEC. After an additional check for completeness, the personal data is coded and the information
is stored in the database.
The variables used in geocoding death data are identical to the ones used for birth data. In creating the attribute file, variables
are temporally selected and causes of death are grouped into disease and nondisease categories. Causes of death are classified
for purposes of statistical tabulation according to the International Statistical Classification of Diseases, Injuries, and Causes
of Death, published by the World Health Organization. Only the underlying cause of death is used for data aggregation.
Data Preparation and Geocoding
Address accuracy and the geocoding match rate were improved by using StreetRite, a commercial software program, to check
and correct residential addresses by running these addresses against a database containing every mailing address in the
United States. Common errors, such as misspelled street names or missing ZIP Code, city, or state information, were identified
and corrected. Any remaining unmatched records were manually checked and corrected if possible.
Geocoding, the process of linking a common location identifier such as address to a spatial database such as Census
TIGER/Line files, was conducted by GDT. Health data was address matched to the
Dynamap/2000 street network data.
Sources of Error in Geocoding
The geocoding match rate, which reflects the accuracy of the geocoding process, depends on the quality of both address and
geographic data. Some errors are inherent to the process, and it may be difficult to determine the accuracy of the results.
Documenting potential error sources and understanding how they affect the quality of the results are important. Address accuracy,
address allocation, and assigning locations for aggregate data are areas that were found to affect the match rate.
Address Accuracy
Error can be introduced when the mailing address (typically a post office box) is supplied in place of the residential address.
New addresses created during the calendar year that do not exist in the current street/road database will also reduce the geocoding
match rate.
Address Allocation
Though the geographic data used for geocoding contains a wealth of information about street locations, address ranges, and
related information, it is not complete and varies in quality from area to area. In urban areas, the percentage of street segments
that contain address ranges may be as high as 90 percent. However, some rural areas do not contain any address ranges.
Therefore, the geocoding match rate is dependent on the study area.
Assigning Geographic Locations
In the geocoding process, each address in an event table is compared to the address ranges in a target address database.
When an event address matches the address range of a street segment, an interpolation is performed to locate and assign
real-world coordinates to the address in the event table. For example, given a line with endpoint values of 0 and 100 and a street
address of 50, the location of the address is estimated at the line's midpoint. However, the actual street address may not be l
ocated at the midpoint of the line segment. During the aggregation process there is the potential for a small percentage of geocoded
data to be captured in the wrong polygon.
Data Aggregation Using ArcInfo
Data aggregation is accomplished using ArcInfo Version 7.0 or higher in a UNIX or Windows NT environment.
Two database files are required for data aggregation--the birth variable file and the census TIGER/Line file. The linkage between these
two files was established through the common field County Census Tract Number. For example, to aggregate data for live births
by prenatal care visits, the user would follow the steps below.
Select birth data file (INFO file).
Select item for mother's race.
Select item for prenatal care visits.
Select census tract data file (INFO file).
Select item name for county tract number.
Give a file name for output file (dBASE file).
Define item name for each factor. Click the Use Default button to use default names.
Once data has been aggregated, it can be queried using the Health Data Query System, an ArcView GIS application.
Viewing Health Data
The Health Data Query System was developed as an ArcView GIS Version 3.0a project for use in a Windows NT or UNIX environment.
Users invoke the project by clicking on a custom button in the project GUI.
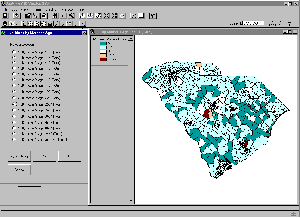 A query screen allows users to select variables.
Subsequent screens present contextual variable subchoices. For instance, selecting Live Births by Mother's Age will bring up
a screen with age range choices. The numeric breakout of these ranges is a mirror of the census data available at the tract level.
This decision was made to allow rates and ratios to be generated at some future time.
A query screen allows users to select variables.
Subsequent screens present contextual variable subchoices. For instance, selecting Live Births by Mother's Age will bring up
a screen with age range choices. The numeric breakout of these ranges is a mirror of the census data available at the tract level.
This decision was made to allow rates and ratios to be generated at some future time.
The data is displayed on a map in the view. The classification system is based on natural breaks. Using buttons on the interface,
the user can design a layout and print it out. A double-ended color scheme is used where each of two hues represents
and the number of tracts affected by that frequency. Though the actual colors currently used are experimental, the final product
will have a standardized color palette.
Editor's Note: By organizing vital statistics data using GIS, the SCDHEC has made this data much more useful and accessible
while preserving the confidentiality of individual health records. These well-planned and flexible applications have standardized
output and incorporate ArcView GIS for easy querying of the data. Use of census tract data to organize and aggregate vital data
will make this data valuable for others outside of the SCDHEC as it can be used with data from other areas and with data from
other disciplines.
This article was based on a study, "Vital Health and Census Data Integration System," for the South Carolina Department of Health
and Environmental Control by Hsiu-Hua Liao, Paul Laymon, and Kirk Shull.
References
Alpert, S., and K.E. Haynes. 1994. "Privacy and the Intersection of Geographical Information and Intelligent Transportation Systems."
Proceedings of the Conference on Law and Information Policy for Spatial Database, pp. 198-211. Temple, Arizona. October 28-29, 1994.
Croner, C.M., J. Sperling, and F.R. Broome. 1996. "Geographic Information System (GIS): New Perspectives in Understanding
Human Health and Environmental Relationships." Statistics in Medicine, vol. 15, pp. 1961-1977.
Geographic Data Technology. 1997. Dynamap/2000 7.2 User Manual. Lebanon, New Hampshire.
|