|
Earlier issues of ArcUser magazine introduced readers to the U.S. Geological Survey's Earth Resource Observation Systems
(EROS) Internet site, which provides free downloadable data for GIS users. Previous stories described how to download and
convert optional format 1:100,000-scale digital line graph (DLG-O) vectors and how to use these converted files for two-dimensional
and three-dimensional modeling using ArcView GIS and ArcView 3D Analyst.
This issue introduces a USGS Internet site that provides point label data to enhance a model. The data is stored in a geographic
(decimal latitude-longitude) coordinate system. This article describes how to locate and download USGS Geographic Names
Information System (GNIS) point and reproject latitude-longitude GNIS points into Universal Transverse Mercator North American
Datum (UTM NAD27). After loading reprojected points into the model created following the procedures described in previous articles
in this series, topographic and cultural features can be labeled and displayed.
The Bright Angel, Arizona, model developed in the January-March 1998 installment of the terrain modeling series will be used
to introduce GNIS data and the tabular and spatial data concepts needed to download, edit, load, reproject, and label these descriptive
points. Label point sets are quite large and rather complex.
These files will give you a "jump start" and help you to learn difficult concepts and procedures. Several GNIS data sets as well as the converted DXF files for the Bright Angel model are available for
download for this page. See the links section to jump to the GNIS data page to obtain data from other areas. If you have not built
the Bright Angel model, read the previous four articles available from this page.
What Is GNIS?
GNIS is a compilation of labeled points designed by the USGS and the U.S. Board on Geographic Names that contains name and
location information for nearly two million physical and cultural features throughout the United States and its territories.
GNIS data may be downloaded from the Internet or may be purchased on CD-ROM.
The CD-ROM, which includes National Geographic Names Data Base (NGNDB) for all states, also contains the Antarctica Geographic Names Data Base
(AGNDB), Topographic Map Names Data Base (TMNDB), and Reference Data Base (RDB), may be purchased over the Internet.
The data used for the Bright Angel model will be downloaded from an Arizona subset of the NGNDB.
Download and Edit GNIS Files
At the USGS GNIS site you will find summary information about GNIS and GNIS data sets that are available via
FTP. Visit the USGS GNIS page. Two types of compressed files are
available. Files named with the U.S. Postal Service abbreviation followed by _DECI (e.g., AZ_DECI) contain decimal latitude
and longitude. Commas separate fields and single quotes enclose text strings. Files named with the entire state name (e.g., arizona)
include only degree, minute, and second coordinates, and the fields are separated by column position.
Select the file named AZ_DECI and download it. The files, compressed using GZ technology, require an appropriate decompression
utility such as WinZip. The compressed AZ decimal file (AZ_DECI.GZ) is more than 1.3 MB and may require several minutes to
download. Store the GZ file in the same directory as the Grand Canyon project and then unzip the file. The unzipped file will default
to the name arizona. Add a .txt extension to the file during or following decompression.
The extracted file, arizona.txt, should be 9.4 MB and should contain 39,139 records. GNIS metadata, the GNIS data description, and additional information about
structure and completion status is available from the GNIS home page at the USGS Web site.Load the arizona.txt file into a text
editor such as the Windows WordPad or a word processor in text mode to inspect the file. Notice that each record (line)
contains many fields, all separated by commas.
Text within most fields is surrounded (delimited) by a single quote. Note that the first arizona.txt field does not have a leading delimiter and that the last field does not have a trailing delimiter.
This is a major problem and must be repaired before the data set can be used.
 Also note that empty fields are correctly represented
with quotation marks (''). The data structure for the Arizona GNIS decimal data includes 16 fields. Table shown here summarizes suggested field names, field types, and minimum field sizes for each field in the
GNIS decimal data.
Also note that empty fields are correctly represented
with quotation marks (''). The data structure for the Arizona GNIS decimal data includes 16 fields. Table shown here summarizes suggested field names, field types, and minimum field sizes for each field in the
GNIS decimal data.
Reprojecting GNIS Points
To speed up the process of developing this model, download the corrected GNIS data for this project.
The dBASE file GC4GN108.DBF contains 192 GNIS records for the 1:100,000 map GC4 Tile 08 model
that includes Grand Canyon Village, Bright Angel Creek, and Phantom Ranch. Data inconsistencies in arizona.txt are repaired
and the table is ready to load into ArcView GIS.
The GNIS points included in GC4GN108.DBF are referenced in a geographic or decimal latitude-longitude coordinate system.
The Grand Canyon model was created from DLG data in a UTM projection using the NAD27 datum. To use the GNIS points in
the Grand Canyon model they must be reprojected to UTM NAD 27. This can be done by using Projector!,
an extension that comes with ArcView GIS. See these links for additional information on UTM
and datums.
Open the ArcView GIS project used to create the Bright Angel model. Choose View, then Properties from the menu to
rename the view "2. Bright Angel 2D," and verify that map units are set as meters. Next, create a new view to receive the GNIS
data, set the map units to decimal degrees, and name this view "1. Lat Long Data." Using a leading numeral will order the views
in the project window.
In the project window choose Table then click the Add button to incorporate the GC4GN108.DBF into the model.
Open the table and verify that all 16 fields are properly named and populated. Carefully study the fields Lat_Dec_1 and
Lon_Dec_1. These fields will be used to register the data. Some records have a second coordinate pair in the fields
Lat_Dec_2 and Lon_Dec_2. These points label long features such as rivers and streams.
Next make 1. Lat Long Data the current view. From the menu, select View, then Add Event Theme, and specify
the table GC4GN108.DBF. Set the field Lon_Dec_1 as the x Field and Lat_Dec_1 as the y Field. Select GC4GN108.DBF
as the active theme and make it visible to display the 192 points in this table. Check the names and latitude and longitude
before reprojecting this geographic data to UTM NAD27.
Use Windows Explorer or another file manager to locate the Projector! extension (prjctor.avx) in the \ARCVIEW\EXT32 subdirectory.
If it is not in the EXT32 subdirectory, locate it in the \ARCVIEW\SAMPLES\EXT subdirectory or download
Projector! now. Make a copy of projctor.avx and place the copy in the EXT32 directory.
Return to the main project window to load the Projector! extension by choosing File then Extensions from the menu.
Return to the 1. Lat Long Data view. A new button with an arrow icon appears on the right end of the toolbar. This button
runs the Projector! extension. Before running it, make certain that the view's map units are set to decimal degrees.
Projector! requires that view map units are specified. With view 1. Lat Long Data active and GC4GN108.DBF selected, click on
the Projector! button. Specify meters as the output units.
Since the input data is already in a geographic projection, ArcView GIS asks questions about the desired output projection.
Select UTM-1972 as the category and specify Zone 12 as the type. UTM zones are divided into longitude zones six degrees wide.
The central meridian of Zone 12 is �111�. Since this process reprojects point data, it is not necessary to recalculate area, perimeter,
and length, so click No when prompted for items. Answer Yes when asked about adding the reprojected shapefile to an existing
view and specify the 2. Bright Angel 2D view. Name the new theme GC4GN208 or other name that you devise. Save the project.
In the naming convention used for this project, GC4 is the quad designator, GN represents Geographic Names, 2 identifies
a second projection, and 08 specifies Tile 08. Keep careful notes describing the names of
reprojected shapefiles.
The Projector! extension loads the reprojected points into the specified view and places the theme at the bottom of the theme
stack. Locate the points theme named GC4GN208, move it to the top of the stack, and make it active and visible. Use the Identify
tool to check the names of several points. Check the relationship between map elements and points with types including summits,
cliffs, streams, valleys, and more. Give the GC4GN208 theme a more meaningful name such as GNIS Points.
Labeling Topographic and Cultural Features
Make certain that the GNIS Points theme is loaded, visible, and above all the other themes in the 2. Bright Angel 2D view.
From the menu, select Theme, then Properties. In the Theme Properties dialog select Text Labels and specify Name as the label
field. Position the text to the upper right of the label point. Check the Scale Labels box and select OK to close the dialog box.
These label defaults will be available each time you wish to label these points. A sample thematic legend for GNIS points is
included with the sample data. GNISTYP1.AVL uses the Type field to classify GNIS points. Apply this legend to Type and
study the results.
Choose the label font and size by selecting Window then Show Symbol Window from the View menu. Click on the button
with the ABC icon to open the font palette. Select Arial as the font, 10 as the size, and bold as the style, then close the font
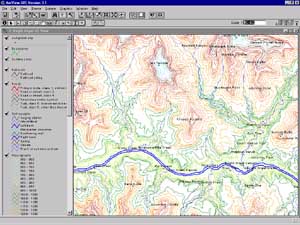
palette. Center the model in the view. Adjust the scale to 1:50,000 by typing 50,000 in the Scale box at the upper right corner
of the interface. You should see the Colorado River flowing from east to west across the bottom of the view and more than 50 GNIS points
should be visible.
To label all GNIS points in the model, make certain the GNIS Points theme is active and visible. Select Theme, then
Auto-label from the menu. In the dialog, select Names from the drop-down box as the Label Field and click the Use Theme's
Text Label Placement Property radio button. Check the Scale Labels box. Click on OK and watch your labels appear. Zoom
and then out. Observe how the font expands and contracts as the scale changes. Many labels overlap when using the scale
and font parameters suggested above.
Experiment with another labeling procedure by again zooming to 1:50,000. Remove all labels by selecting Theme, then Remove
Labels from the menu. Again, select Theme, then Auto-label from the menu. After specifying Name as the label field, select Find
Best Label Placement and Allow Overlapping Labels. This time most labels are centered above the GNIS point, and overlapping
labels are green. Turning the GNIS Points theme off removes these symbols and graphics from the view. Turn
the GNIS theme on and save the project now. All the labels will be saved with the point theme.
Summary
This article teaches a GIS user with moderate computer skills how to locate, download, and study GNIS data. The data
once properly edited to include delimiters and saved as a comma-separated text file or dBASE file, is registered in a geographic
projection. The ArcView GIS Projector! extension reprojects the geographic data into UTM NAD27 for use with the Bright Angel model
The reprojected GNIS data now labels geographic and cultural features in the model. The Type field can also be used to symbolize
many different point types.
Editor's Note: This five-part series is available from the ArcUser Online Web site at www.esri.com/arcuser.
In response to readers' requests, future ArcUser articles will explore other data issues including the use of large-scale
Spatial Data Transfer Standard Digital Line Graphs (SDTS DLG at 1:24,000) and digital elevation model (DEM) data sets,
labeling map features, and data projection.
This article's author, Mike Price, is testing utilities and procedures that convert and load SDTS data into ArcView GIS. SDTS
is a more robust method for transferring spatial data between dissimilar computer platforms while preserving information.
The newer SDTS structure is more complicated than the older optional format. Issues of projection, datum, and format complicate use of DEM data. He is continually exploring data issues and is always
looking for easy-to-use procedures to introduce to ArcUser readers.
|