Summer 2009
Summer 2009 |
||||||||
|
|
||||||||
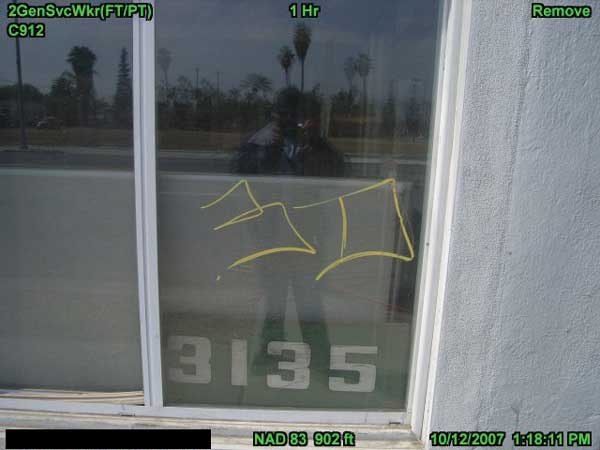
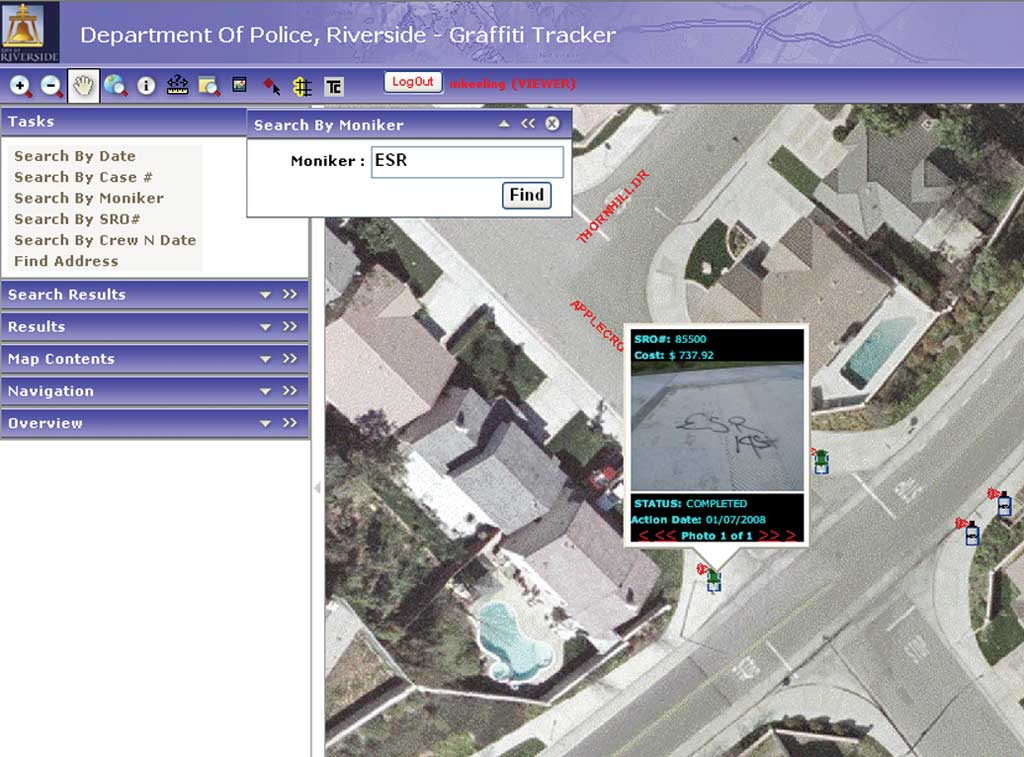
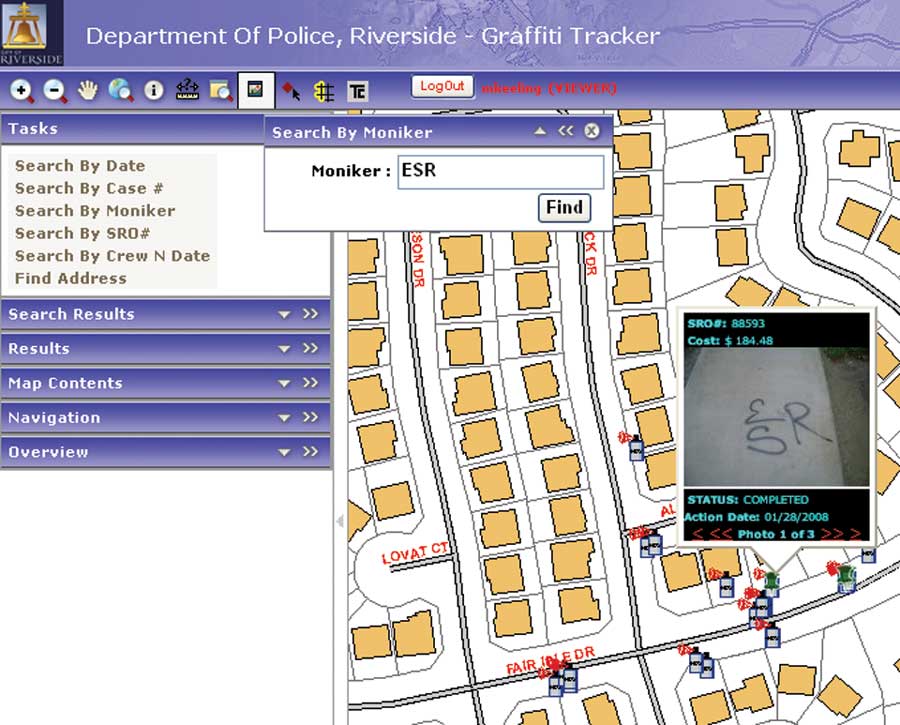
The Public Works, Police, and Information Technology departments of the City of Riverside have developed the Graffiti Abatement Tool (GAT) to coordinate interdepartmental efforts and address the problem of connecting instances of graffiti to an individual vandal (or tagger). GAT, a custom application, was built using ArcGIS Server, ArcSDE, and several other technologies. It stores and manages images of graffiti with other tabular data useful in tracking, prosecuting, and suing taggers for the city's costs in mitigating and removing graffiti. Documenting Where Taggers StrikePublic Works crews that remove graffiti first take a picture of the graffiti using a Ricoh GPS camera and complete a customized digital form on the camera. This form records basic information about the incident. The images and data are then uploaded onto a server that automatically adds the data to a spatial layer in ArcSDE. Taggers sign their works with distinctive monikers so identifying the creator of an instance of graffiti is simple. Using an ArcGIS Server application, the Police Department's graffiti task force matches these images with other instances of graffiti by the same tagger.
Having a spatial layer that locates graffiti gives the Police Department many advantages. Taggers will often provide useful information, such as gang affiliation, within the graffiti lettering. The police can perform GIS analyses to find trends in tagging and identify problem areas. Some graffiti is associated with a street gang or a specific tagging crew. If so, this data is entered into the application so police can determine when and where these crews are active and get a general idea of gang territory. All the graffiti data is available to the Police Department in a user-friendly application. Capturing the Cost of GraffitiGAT allows the total cost—from an individual event to all graffiti caused by a specific tagger—to be easily calculated. When the Public Works abatement crew removes the graffiti, the cleanup method and materials used are entered as well as how much time was required for removal, and GAT calculates the cost of removing the graffiti. The Public Works Department can determine where money is being spent on graffiti removal and the neighborhoods and wards where tagging most often occurs. When investigating graffiti-related crimes, the Police Department also enters the cost of each investigation into the GAT system. The documentation of graffiti investigations becomes criminal evidence. Due to the sensitive nature of this information during a criminal investigation, partitions have been made in the system that separate the data for the Police and Public Works departments. The Public Works segment includes the graffiti images, location, and removal costs, while the Police portion appends information on the tagger, moniker, and the victim. The costs associated with prosecuting and suing a tagger in a civil lawsuit are entered by the city attorney. If the tagger is a minor, the city attorney can sue the parents or legal guardians, giving them a strong incentive to keep their children away from such activities. GAT allows for the construction of a proper chain of evidence for both the prosecution and the civil lawsuit by providing picture evidence with time stamps, costs, digital images, and locations. Integrating Technologies
GAT was built by integrating a number of technologies. The Ricoh GPS cameras are the primary input devices. Public Works crews complete customized forms that are simple, easy to use, and require minimal training. ArcSDE handles the storage of graffiti data, including geometry, images, and attribute information, while an ArcGIS Server application provides the user interface. Several Microsoft technologies, including SQL Server 2005, SQL Server 2005 Reporting Services, and AJAX, were used for other parts of GAT. Other features that may be added in the future include more complex analysis built directly into the application and wireless upload from the cameras using the City of Riverside's free wireless Internet service. A key aspect of GAT is its global architecture. Because vandalism does not respect city boundaries, the City of Riverside hopes GAT will eventually provide a regional graffiti/tagger tracking and abatement system. Other jurisdictions would simply provide their own servers and GPS-enabled cameras to use GAT. The entire region could benefit by sharing data across jurisdictional boundaries. For More InformationTo learn more about GAT, contact Matt Keeling, GIS analyst, City of Riverside, at mkeeling@riversideca.gov. To learn more about creating enterprise-wide applications, the instructor-led course, Data Management in the Multiuser Geodatabase, is offered by Esri. Visit www.esri.com/training to sign up. |