Summer 2009
Summer 2009 |
||||||||
|
|
||||||||
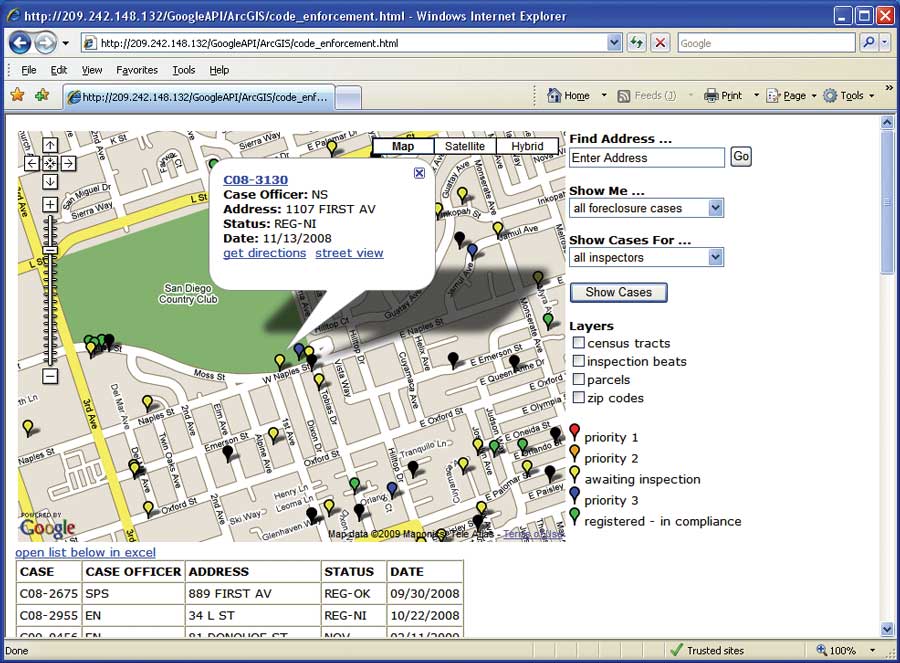
During the past decade, the City of Chula Vista has been among the fastest growing cities in the United States. With a current population of about 200,000, Chula Vista experienced a significant increase in the number of single-family homes built during this period. At the height of the 2004�2006 building boom, it was not unusual for the Planning and Building Department to issue more than 2,000 building permits per year. In recent years, the cooling housing market has led to a decrease in permits issued and an increase in foreclosures. These vacant houses have a negative impact on the surrounding neighborhood and the community as a whole. Many homes in the foreclosure process remain vacant and are not maintained for months. Blighted properties can discourage potential buyers of adjacent properties and reduce property values in a neighborhood by thousands of dollars. To combat problems associated with unmaintained properties, city leaders approved the Residential Abandoned Property (RAP) ordinance in October 2007. It requires the financial institution foreclosing on a property to maintain the vacant house to neighborhood standards. The Code Enforcement Division is charged with enforcing compliance with this ordinance. To manage more than 2,000 foreclosed properties, enforcement staff must identify where the highest concentration of foreclosure activity is occurring and quickly monitor data both in the office and field. Although Code Enforcement Division staff maintained RAP data in Permits-Plus, the city's permitting system, they preferred a system that could visualize property locations. Code enforcement staff approached the GIS team and requested a digital map to identify these foreclosure locations. This would allow them to see clusters of foreclosures and help determine where to focus resources. In 2005, Chula Vista built CVMapper, a custom ArcIMS viewer for city staff to display and query common GIS layers. Initially, the GIS team discussed adding the RAP data directly to the ArcIMS viewer as a separate layer. Although this was a workable solution, code enforcement staff preferred a simple, lightweight map interface that would display up-to-date property locations. A key component of the project was furnishing current, accurate data. When code enforcement officers returned to the office from field inspections, the Web site would require updating to reflect the latest inspection data and current inspection status of each property. Another key consideration in the Web site design was the sensitivity of the data. The RAP database contains phone numbers, e-mail addresses, and other personal data that should only be available to the Code Enforcement Division. The GIS team ultimately decided to build a Web site based on ArcGIS Server, using ArcGIS JavaScript Extension to the Google API and the ArcGIS API for JavaScript. "We thought this was a great opportunity to take advantage of the mashup capabilities of ArcGIS Server and create a simple Web page that merged the locations of foreclosure properties on top of a Google map," said Bob Blackwelder, the GIS manager for Chula Vista. Since Chula Vista maintains its GIS data in ArcSDE using a Microsoft SQL Server enterprise geodatabase, staff can easily integrate GIS data with other city databases, including the RAP data, which is also stored using Microsoft SQL Server. The first step in creating the Web site was to spatially enable the RAP data. The GIS staff created a simple ArcSDE database view using the city's parcel layer. Using Microsoft Visual Studio, the view was modified to include the RAP program data. The modified ArcSDE view linked each record in the RAP database to a parcel feature based on the unique assessor parcel number (APN). Since the database view retrieved data directly from the Permits-Plus database, this also ensured the RAP locations and property status were always current on the Web page. The ArcSDE database view data was added to an ArcMap document along with a few additional GIS layers. These layers, including parcel boundaries, city boundary, census tracts, and ZIP Code boundaries, were added to provide reference and background information for the digital map. The ArcMap document was then published as a map service and embedded into a Web page. Using the ArcGIS JavaScript Extension to the Google API and the ArcGIS API for JavaScript, the GIS team created the Web site and embedded the digital map into the HTML document. "With a basic understanding of HTML and JavaScript, we were able to use some of the sample scripts available on the Esri site and get the initial site up and running in a few days," said Blackwelder. With its debut in November 2008, the new mapping site is used in the field on a daily basis by code enforcement staff. Previously, staff had no way of identifying clusters of foreclosure properties. Now, each property is mapped with a standard Google "balloon" and color coded based on the inspection status. Users can click on the balloon to retrieve the case number, status, and program date for the selected property. Code enforcement officers can open the mapping site prior to field visits, see clusters of properties to inspect, and plan their day accordingly. Using a pull-down list, they can display all RAP data or view just single-family or condominium locations. Another pull-down list allows users to map all properties or just properties assigned to a specific code enforcement officer. As officers in the field collect data about a foreclosed property, the data is fed directly to the Permits-Plus server. This allows office staff and field inspectors with wireless capabilities to immediately view updates to inspection status on the Web page. Since the initial development of the mapping program, management in the Code Enforcement Division has noticed a significant increase in productivity. Many code enforcement officers report that the productivity increase is a result of having more time to process cases rather than spending time determining property locations or printing driving directions between locations. Additional tools have also been added based on end-user comments and feedback. One link, added to each property, provides driving directions from city offices to the site. Another link brings up Google street-level images for the selected property. Users can use the mapping site to zoom to an area and export all data within the map extent as a Microsoft Excel file. With the success of the RAP viewer, Chula Vista is considering other ways to take advantage of ArcGIS Server to create more online maps that would link business data and map services in a simple Web site. The Public Works Department would like to map city assets along with related information from the city's GBA Master Series software [a work management system]. Using ArcGIS Server, they could build a project-specific mapping site and allow staff to view recent fieldwork related to these assets. For more information about this program, contact Bob Blackwelder, GIS manager, City of Chula Vista, at bblackwelder@ci.chula-vista.ca.us or Chris McCoy, development services officer, City of Chula Vista, at cmccoy@ci.chula-vista.ca.us. To learn about creating these types of applications, two instructor-led courses, Introduction to ArcGIS Server and Building Web Maps Using the ArcGIS API for JavaScript, and a free Web training seminar, Building Mashups Using the ArcGIS API for JavaScript, are offered by Esri. |