ArcUser Online
This article as a PDF . Hershey, Pennsylvania, experienced a sudden and unexpected loss of visitor and resident patronage in its downtown. In 2008, Hershey Entertainment and Resorts, an entertainment and hospitality company dedicated to preserving the legacy of Milton S. Hershey, hired a GIS consulting firm to help attract consumers back to the area. Retail trade area analysis is a necessary part of any civic development plan. To find a target market and gain knowledge about local consumers, geographic information must be carefully considered. Because GIS software specializes in extracting and aggregating geographic data, it is an ideal platform for conducting this analysis. Esri Business Analyst, which incorporates the Huff model (a tool for formulating and evaluating geographic business decisions), was instrumental to the process of successfully reenvisioning Hershey's downtown. Location-Based ProblemThe town of Hershey was originally designed by Milton S. Hershey to serve the needs of chocolate factory employees and their families. Built in the early 1900s, the original town included housing for factory employees as well as schools, churches, recreational facilities, and a trolley system. By the early 1930s, downtown Hershey had grown to become the center of activity for Hershey residents, with a bank, theater, department store, hotel, amusement park, and community center.
As the town grew and the number of visitors increased, Pennsylvania enhanced the local highway system to accommodate the increase in traffic volume. However, enhanced highways had the unintended effect of directing commerce away from downtown Hershey, enticing residents and visitors to shop in suburban shopping centers. A New VisionIn 2005, Hershey Entertainment and Resorts drafted plans to revitalize the downtown. The revitalization effort started with the restoration of a prominent downtown building originally constructed in 1916 for printing candy labels. The newly renovated building opened in the summer of 2006 and is now home to two new restaurants on the ground floor, with the Hershey Entertainment and Resorts corporate offices occupying the two upper floors. Later, an interactive museum, the Hershey Story, was located adjacent to the renovated press building. In 2008, Hershey Entertainment and Resorts contracted Delta Development Group, Inc., a community planning firm located in nearby Mechanicsburg, Pennsylvania, to conduct the next phase of revitalization. With design assistance from EDSA, a landscape architecture and urban design firm from Baltimore, Maryland, Delta began a yearlong process of creating a new vision for the downtown area. In keeping with Milton Hershey's original vision for downtown Hershey, the revitalization plan was based on the needs of the community while reestablishing a balance between the downtown and the surrounding resort, school, medical, and commercial areas. The goal was to make downtown Hershey serve the community so residents and visitors wouldn't need to go elsewhere. An Integrated Formula
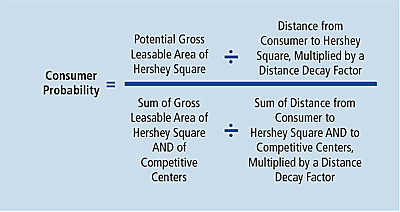
As Delta assessed the ability of Hershey's market area to support revitalization, EDSA evaluated the downtown's physical opportunities and constraints in preparation for creating conceptual designs. The ultimate challenge facing the team was creating a design concept with the right mix of appropriately sized uses clustered to capture the opportunities presented by the local market. The first phase of analysis would be to profile and measure the local market for real estate uses such as retail, residential, office, and public spaces. In running demographic reports for comparative analysis, the most difficult task for Delta was determining the geographic trade area for downtown Hershey that would be used as a basis for estimating the amount of retail and restaurant space that could be supported. "The big question we needed to answer was, 'How far would people be willing to drive to shop and dine in downtown Hershey?'" said Debbie Tollett, senior associate at Delta Development Group. "To answer that question, we used the original Huff gravity model in Business Analyst." The Huff model is an analytical tool that measures the probability that a consumer will drive to a proposed new development site based on the distance they would have to travel to get there, the attractiveness of the development, and the area competition. It is assumed that the probability that consumer will travel to the site increases as the size of the site increases and as the distance or travel time for the consumer to the site decreases. [The Huff model was developed by Dr. David Huff of the University of Texas and first published in 1963. To learn more about the Huff model, see "Parameter Estimation in the Huff Model" by David L. Huff in the October�December 2003 issue of ArcUser magazine.]
Once Delta established the geographic market area, it could conduct a more detailed evaluation of consumer spending and identify target retail tenants for further analysis. However, at this juncture, the analysis had focused on general retail spending. With an estimate from EDSA regarding the contiguous land area in the downtown that was available for development, the Delta team approached the analysis by assuming that this land could be developed into Hershey Square, a town center with leasable retail space that could compete with surrounding suburban retail centers. Bringing the Formula to LifeApplying Hershey-specific assumptions to the Huff model gave a clearer picture of the local market. Those assumptions and the Delta team's input for the model included the following five components:
Results: Local Market DefinedBased on these inputs and calculations, the Huff model provided spending probabilities by block group that allowed the Delta team to identify a defensible trade area. This resulted in a conceptual design and scale for downtown Hershey that was driven primarily by the local market. While the Huff model requires the user to have at least a conceptual understanding of how the model works and how various input components impact the model output, Business Analyst's user-friendly interface allowed the Delta team to access precise analytic capability that would otherwise be outside the realm of its expertise. "Before discovering the Huff model operations in Business Analyst, I tried to do the equation on paper," laughed Tollett. "All the variables that need to be plugged into the formula ate way too much time. Performing the operation in an integrated environment made all the difference in getting the quick and accurate results we needed." Learn More OnlineListen to "Esri Business Analyst Online Successfully Fills Commercial Vacancies" |