Assembling DEM Files
for Watershed Analysis
by Greg Easson and Harold Robinson
University of Mississippi, Department of Geology
and Geological Engineering

| Assembling DEM Files by Greg Easson and Harold Robinson | |
|
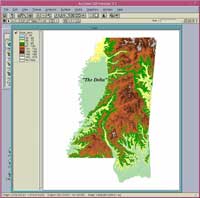
Editor's note: The authors describe how they mosaicked individual 7.5-minute digital elevation model (DEM) data files describing the Little Tallahatchie River basin in Mississippi into one large, seamless DEM using the ArcGrid extension for ArcInfo. The addition of elevation data makes an ordinary map more appealing to the viewer, more informative, and more useful for analysis. Elevation data is available from the U.S. Geological Survey EROS Data Center (USGS–EDC) in a variety of formats including digital contour lines stored in digital line graph (DLG) format and DEM data stored in Spatial Data Transfer Standard (SDTS) format. Elevation data is also available in a range of scales from the very general (1:1,000,000) to the more detailed (1:24,000). Coarse resolution DEM data is useful for State-wide or regional studies but is not sufficiently detailed for use in basin and watershed analysis. For smaller areas, the more detailed 30-meter resolution DEM data is required, especially in relatively low relief areas such as northwestern Mississippi.
The topography of northwestern Mississippi is typified by rolling hills in the eastern and central portions of the State and a very flat Mississippi Delta region. The Delta is the ancestral floodplain of the Mississippi River and is an extremely low relief area that has had a large portion of its natural streams modified by channelization. The modification of the natural drainage, combined with low relief in the area, make it very difficult to delineate drainage basins for analysis. As part of an Ecosystems Indicators Project funded by the United States Environmental Protection Agency (USEPA), a detailed elevation model of the Little Tallahatchie River basin was needed by one of the authors. The model is being used to characterize the surface hydrology and to delineate subbasins and small watersheds in the Little Tallahatchie River basin. The subbasins and individual wetlands in the watersheds will be analyzed to determine the impact of agrichemicals on the biological communities and water quality in the wetlands. Thirty-meter DEM data provides the level of detail required for a useful model of the basin and subbasins. These areas must be accurately defined so that researchers can know which wetlands are affected by the activities in a particular agricultural field and nonpoint source pollution from these fields. To construct the basin model of the Little Tallahatchie River, more than 50 data files were acquired from the USGS–EDC site. All files were in SDTS format that can be imported into either ArcInfo or ArcView GIS. Recent articles in ArcUser magazine written by Mike Price of Esri have presented detailed instructions on the acquisition and importing of SDTS DEM data. Selecting and Preparing DataThe construction of a large DEM from 1:24,000-scale digital data is not always a straightforward process. Some of the complications that can arise include difficulty in finding the desired data in the desired format and gaps where data sets do not overlap. USGS DEM data at this scale corresponds to USGS 7.5-minute topographic quadrangle maps, and in some areas, quadrangles do not overlap. DEM data available at the USGS–EDC Web site is organized by quadrangle name. Searches will often return multiple files for the same quadrangle. Determining which files are actually needed is problematic. Generally, it is better to download all files for a quadrangle and delete unnecessary files later because of difficulties in determining the exact contents until the data is extracted from the tar (Tape ARchive format) file. Duplicate files are sometimes updated versions of the same data. Other duplicate files provide the same data but use different units of measurement (i.e., meters versus feet). One way to determine the units used is to examine one of the files with a .DDF extension. These files are generated during the tar extraction process. Using a text editor, examine the DDOM.DDF file. The last line of the file contains a keyword--either meters or feet--denoting the units used. The ArcInfo command SDTSINFO will indicate whether the file is an updated version of the data and will give the name of the quadrangle. Extract only one tar file at a time into the same directory because the multiple DDF files associated with each data set can have the same four-digit prefix and may be overwritten if multiple files are extracted at the same time. After extracting and evaluating the contents of the tar file, import any of the extracted files needed and delete the associated source files before proceeding to the next tar file. Project DataThe elevation model of the Little Tallahatchie River basin required more than 50 quadrangles. Because some quadrangles referenced different versions of the data and some were in feet while others were in meters, approximately 80 files were downloaded, extracted, and evaluated for import into the project. Once all the quadrangles needed for the Little Tallahatchie River basin were imported, and elevation units converted when necessary, the next step was combining them into a single, continuous DEM of the basin and reprojecting the DEM into a custom projection for Mississippi. Functionality in the ArcGrid module of ArcInfo makes the process of joining multiple grids together into one grid quite simple. However, joining grids did not immediately result in a seamless DEM of the basin. Dealing with NODATA ValuesCells with a NODATA value are those cells for which a valid value is not known such as cells past the edge of a quadrangle. NODATA and "0" (zero) are not the same--0 is a valid cell value. Data from USGS-EDC in SDTS format uses -32766 to denote NODATA cells. Both ArcInfo and ArcView GIS use a value of -9999 to signify NODATA cells and consider -32766 a valid value that can be incorporated into the grid. This problem can be fixed by resetting the NODATA value for the DEM grid in either ArcInfo or ArcView GIS. Resetting the NODATA value in ArcInfo can be done using a simple one-line command at the GRID prompt shown here: GRID% In this example, out-grid is the new grid to be created with the null value correctly set, SETNULL is the GRID function to be performed, in-grid is the input grid on which the function will be performed, and == (double equal sign) is the Boolean operator used for analysis of the in-grid.
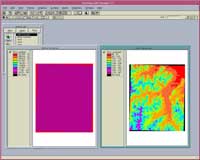
The SETNULL function evaluates each cell in the in-grid looking for a true return for the first part of the function ( Using the ArcView Spatial Analyst extension for ArcView GIS to reset the NODATA value is also a fairly simple process. With the grid as the active theme, perform a query on the values field to select all cells not equal to -32766. Choose Themes > Convert Selected to Grid. This will duplicate the grid while resetting the NODATA value. The grid generated by ArcView GIS using ArcView Spatial Analyst is directly compatible with the ArcGrid module of ArcInfo. Assembling the Basin DEMOnce the NODATA values were set correctly for the Little Tallahatchie River basin data using ArcInfo, the MOSAIC command in ArcGrid was used to assemble multiple DEMs into a single larger DEM using the command shown here. GRID% In this command statement, out-grid represents the final mosaic of grids, mosaic is the GRID function that creates one grid from two or more adjacent grids, and ( Producing a Seamless DEM
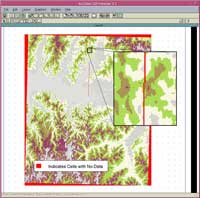
When the grid created using the MOSAIC function was displayed, cells with NODATA values were evident at the original quadrangle boundaries. These areas were missing data because the original data from adjoining quadrangles did not meet, and the MOSAIC function does not interpolate and fill this gap. These gaps had to be corrected before the data could be used for basin analysis. In most cases, the gaps between quadrangles were quite small--one to two cells wide. These smaller gaps can be corrected using a single GRID function, FOCALMEAN. For each cell location in the input grid, FOCALMEAN finds the mean values within a specified neighborhood and places that value in the corresponding cell location in the output grid. [The neighborhood for a FOCAL function is a smaller spatial area within the study area that can be specified as a rectangle, circle, annulus (donut), or wedge or can be created by an irregular or weight kernel file.] Cells with a NODATA value are assigned this mean value. Gaps greater than two cells wide are corrected in a similar manner with the FOCALMAX function. It assigns the maximum value in a specified neighborhood to NODATA cells. Gaps larger than two cells required that the FOCALMAX function be used more than once. It is best to incorporate the procedure into an ARC Macro Language (AML) program. Correcting and filling the small gaps between joined grids can be done at the GRID prompt with the command: GRID% This command will evaluate the in-grid. When a NODATA value is encountered, the FOCALMEAN function replaces the NODATA cell with the mean value of the cells in the neighborhood, specified here as rectangle three cells by three cells. This function will correct all gaps less than three cells wide. Repeating the command will correct any gaps that were originally three or four cells wide. It is best not to use this command for gaps wider than three cells as the result is a value less than the maximum of the surrounding cells and can result in an artificial channel at the quadrangle boundary. Larger gaps are the exception. They can be corrected by applying the FOCALMAX function by running the process with an AML until the gap is filled. If FOCALMEAN is used, the result is an area of lower elevation because the mean of several values is always less than the maximum value. The FOCALMAX function will fill the gap with the maximum value in the neighborhood. This will result in a small flat area in the DEM. While this may not be correct, it does not cause the basin delineation process to be unsuccessful. Increasing the neighborhood size used with FOCAL functions will fill the gaps in fewer cycles. However, a more representative surface can be created by keeping the neighborhood small and processing the grid multiple times with a FOCAL function incorporated into an AML. For each additional pass, the out-grid of the previous pass is used as the in-grid. Filling all the gaps using the appropriate function resulted in a seamless DEM of the basin. The FILL function was then used to fill in sinks and level peaks that represented errors in the DEM data so that it could be used for performing watershed analysis. These gap fill methods presented did not create a completely accurate DEM with correct elevations for the cells in the gaps, but they did provide a methodology for joining 50 1:24,000-scale DEM files into a detailed elevation model for the Little Tallahatchie River basin study area and can be used to create models for analysis or for topographically enhancing a map.
For more information please contact Greg Easson, director of the University of Mississippi Geoinformatics Center, e-mail: geasson@olemiss.edu. About the AuthorsGreg Easson is an assistant professor of geology and geological engineering at the University of Mississippi where he teaches GIS and remote sensing classes. He is also the director of the University of Mississippi Geoinformatics Center, a NASA-funded interdisciplinary research and educational initiative designed to increase the use and awareness of geospatial information technologies in many departments. Easson has used ArcInfo since 1988 and is an authorized ArcView GIS trainer. Harold Robinson is a graduate research assistant and GIS technician at the University of Mississippi in the Department of Geology and Geological Engineering. He currently serves as the GIS specialist on an EPA-funded Ecosystems Indicators Project researching the effects of agrichemical impacts on related wetland ecosystems. He is also a doctoral candidate whose research topic concerns GIS issues related to the ongoing USEPA project. Robinson has been an ArcInfo and ArcView GIS user since 1996. |